Introduction to Optical Microscopy
The invention of the microscope is known as the symbol of mankind entering the atomic age. Its invention and development have gone through a long historical process.
In the 13th century, the world-renowned traveler Marco Polo introduced Chinese glasses to Europe, enabling Europeans to learn the technology of grinding glasses. It was soon discovered that a convex lens with a thick center and thin sides could produce a magnified image of an object.
At the end of the 16th century, Yas Jansen used two lenses to make the world’s earliest simple optical microscope. In 1674, Dutch microscopist Antony Leeuwenhoek invented the world’s first optical microscope, and observed red blood cell nuclei in the blood of salmon for the first time, and later discovered bacteria from tartar, which opened the way for humans to use instruments to A new era in the study of the microcosm.
In the middle of the 19th century, German pathologist Rudolf Weirshaw created cytopathology with the aid of a microscope, making historic contributions to pathology and even the development of medicine as a whole. It can be said that without microscopy there would be no cytopathology.

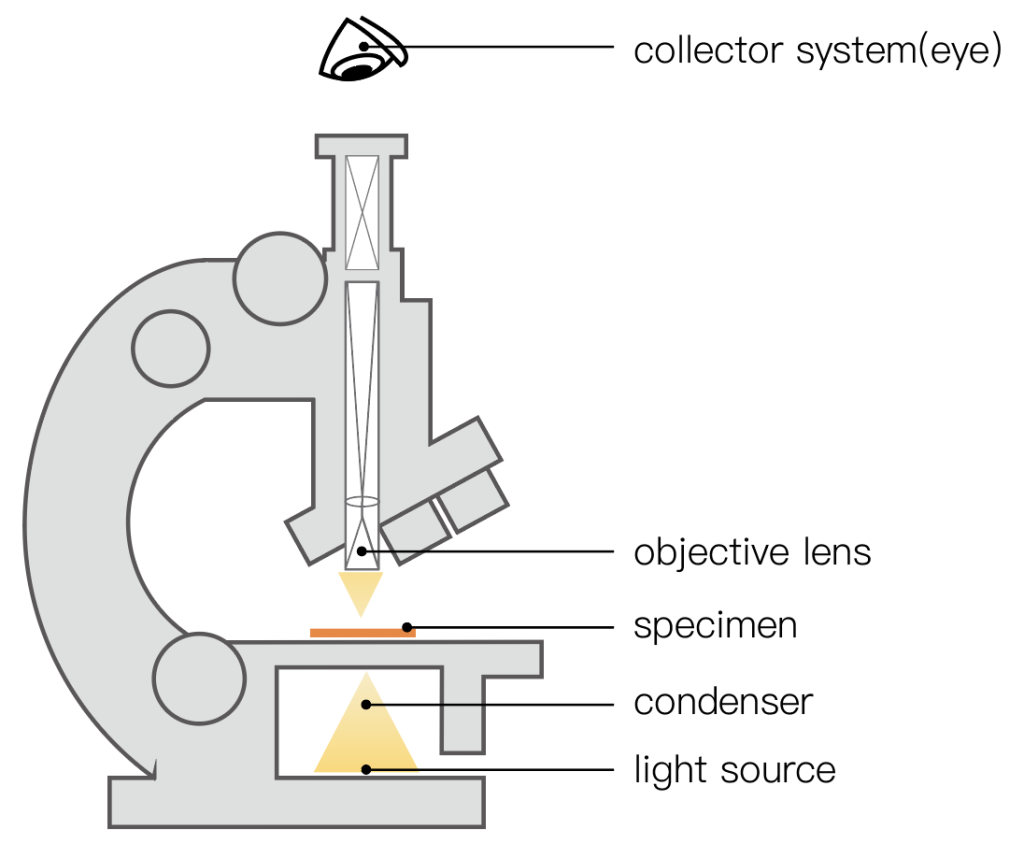
Ordinary biological microscope consists of three parts, namely: ① illumination system, including light source and condenser; ② optical magnification system, composed of objective lens and eyepiece, which is the main body of the microscope. In order to eliminate spherical aberration and chromatic aberration, the eyepiece and objective lens are composed of complex The lens group constitutes; ③Mechanical device for fixing materials and convenient observation
(1) Bright field (BF)
Brightfield imaging is the most common microscope observation method, and it is also the most commonly used observation method for observing biological samples and material samples. What was the first brightfield image you saw under a microscope? It should be the purple onion epidermal cells under the transmitted bright field in biology class!
Immunohistochemical staining, which is often used in biological research, is also bright-field imaging. Different samples will appear in different colors according to different labeling methods. Antibody labeling or dye development can also be used to distinguish different components.
In the HE image below, the nucleus is marked in blue, and the cytoplasm is stained in pink.
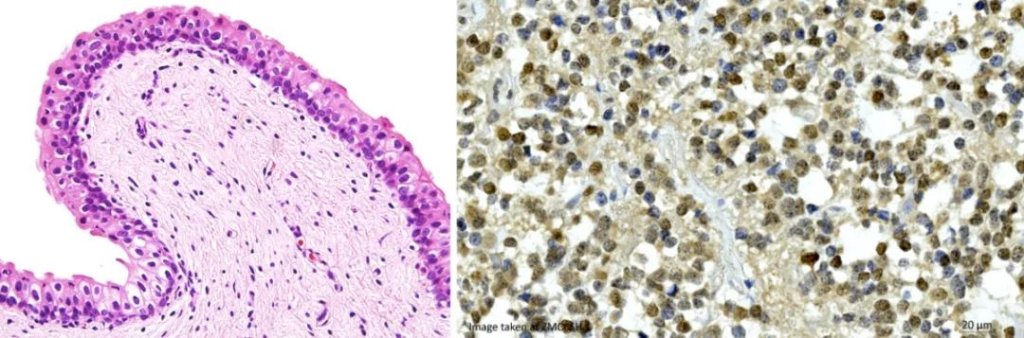
This method is simple, effective and low cost. However, due to the limited number of labeled components, the scope of application is not wide, and the contrast is not too obvious, so it is impossible to judge the positive result.
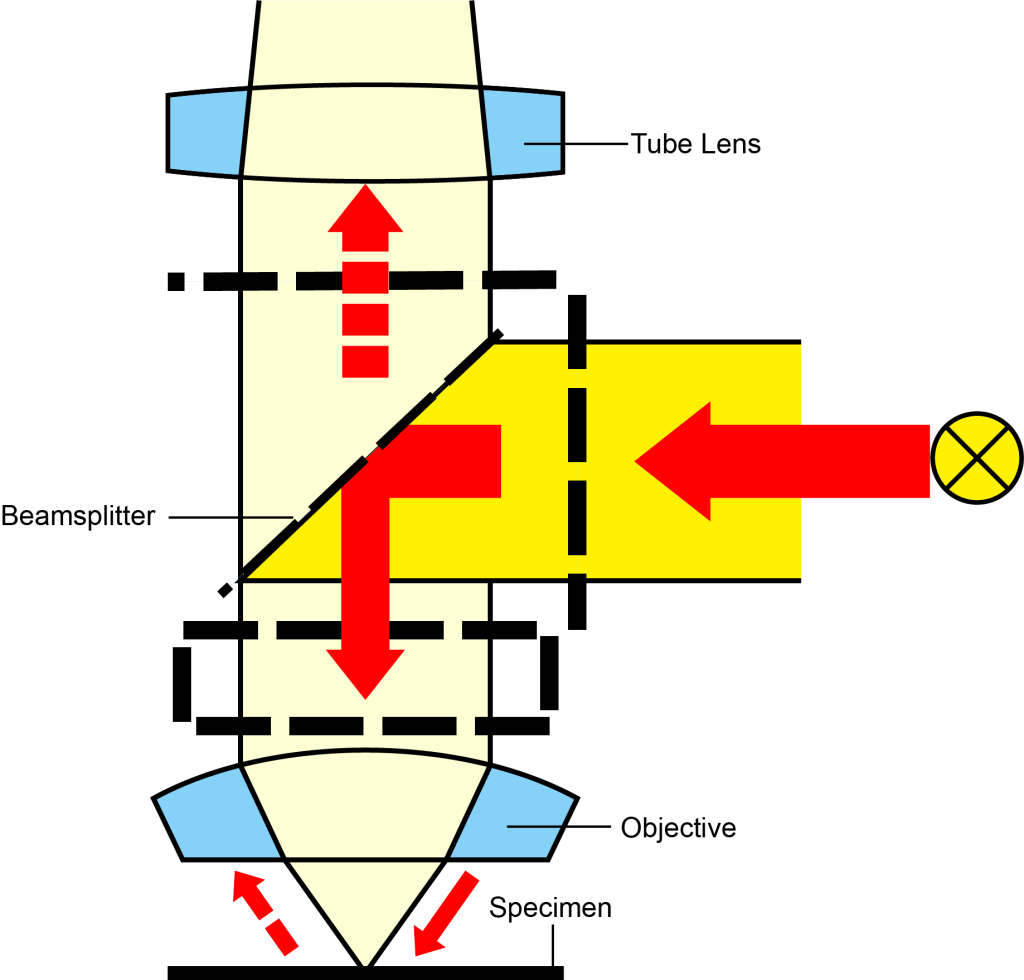
To observe opaque material samples, reflected brightfield is the most commonly used observation method. The light source is directly irradiated on the surface of the sample, and the structure of the surface has different degrees of reflection and absorption of the irradiated light. The brightness and darkness of the image reflect the roughness and light absorption of the sample surface.
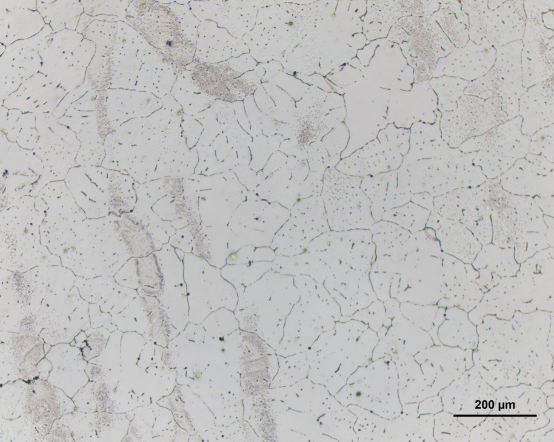
The figure below is the structure of the reflection bright field observation method and the image of the metal pure aluminum bright field. With the help of the bright field image, the size and shape of the pure aluminum grain can be clearly obtained.
(2) Fluorescence microscope (FL)

A fluorescence microscope uses ultraviolet light as the light source to irradiate the object under inspection to make it emit fluorescence, and then observe the shape and location of the object under the microscope. Fluorescence microscopy is used to study the absorption and transportation of substances in cells, the distribution and localization of chemical substances, etc. Some substances in cells, such as chlorophyll, can fluoresce after being irradiated by ultraviolet rays; although some substances themselves cannot fluoresce, they can also fluoresce after being stained with fluorescent dyes or fluorescent antibodies after being irradiated by ultraviolet rays. One of the tools for qualitative and quantitative research of such substances.
The difference between a fluorescence microscope and an ordinary microscope is as follows:
- 1. The illumination method is usually episcopic, that is, the light source is projected on the sample through the objective lens
- 2. The light source is ultraviolet light, the wavelength is shorter, and the resolution is higher than that of ordinary microscopes;
- 3. There are two special filters, the one in front of the light source is used to filter out visible light, and the one between the eyepiece and objective lens is used to filter out ultraviolet rays to protect the human eye.
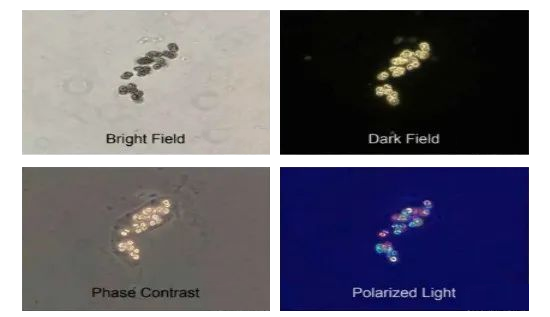
(3) Dark field microscope (DF)
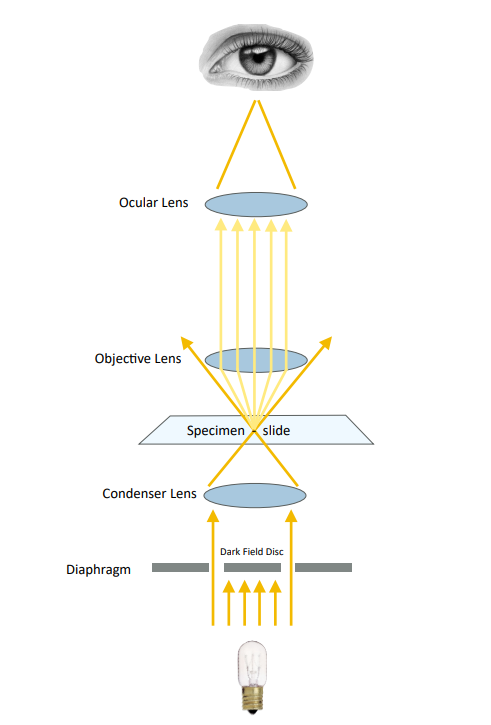
There is a light sheet in the center of the condenser of a dark field microscope, so that the illumination light does not directly enter the objective lens, and only the light reflected and diffracted by the specimen is allowed to enter the objective lens, so the background of the field of view is black, and the edge of the object is bright. Microparticles as small as 4-200nm can be seen with this microscope, and the resolution can be 50 times higher than that of ordinary microscopes.
(4) Phase contrast microscope (PH)
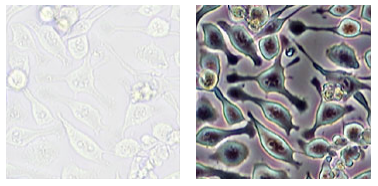
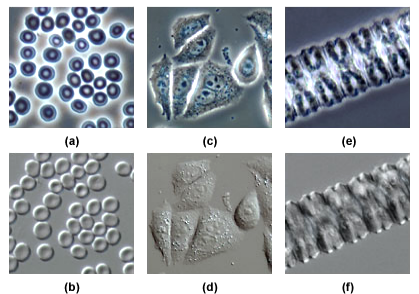
Phase contrast is also a very common observation method for live cell imaging. Since the cells are ill-defined in bright fields, although they can be observed, their boundaries or internal structures cannot be clearly distinguished.
Phase difference utilizes the optical path difference (phase), which is indistinguishable by the human eye, and the optical path difference when light passes through specimens of different thicknesses is transformed into light and dark changes that can be observed by the human eye, thereby distinguishing the structure of the specimen.
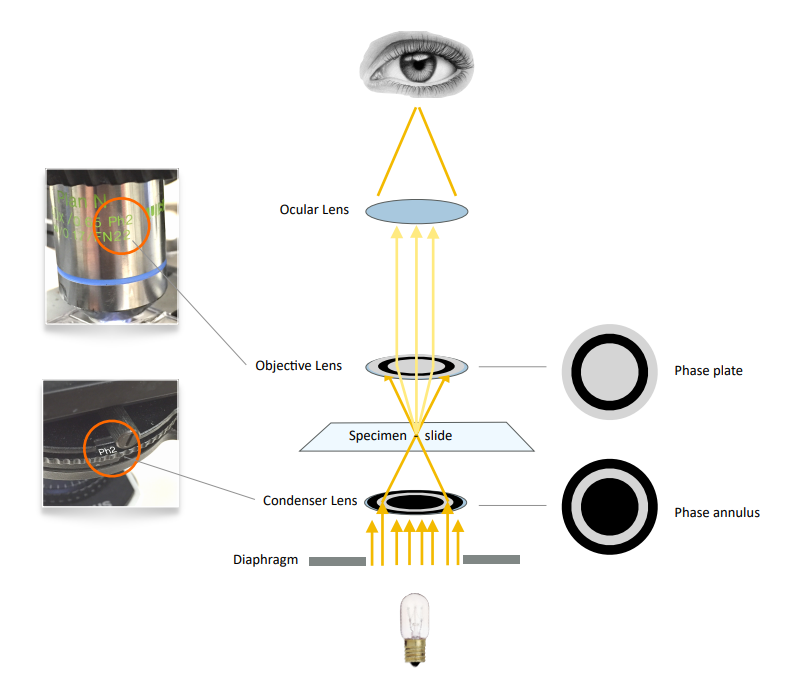
Through the schematic diagram, it is not difficult to find that the key to phase contrast imaging is the matching of the phase contrast ring, and the condenser lens must match the phase contrast ring of the phase contrast objective lens. Phase contrast is a great way to enhance contrast when viewing or imaging living cells in culture, but often results in halos around edge feature outlines, which are optical artifacts that reduce the visibility of border details .
On the other hand, the method is not useful for thick specimens because the phase shifts away from the focal plane, which distorts image detail. Additionally, floating debris and other out-of-focus objects can interfere with imaging of adherent cells.
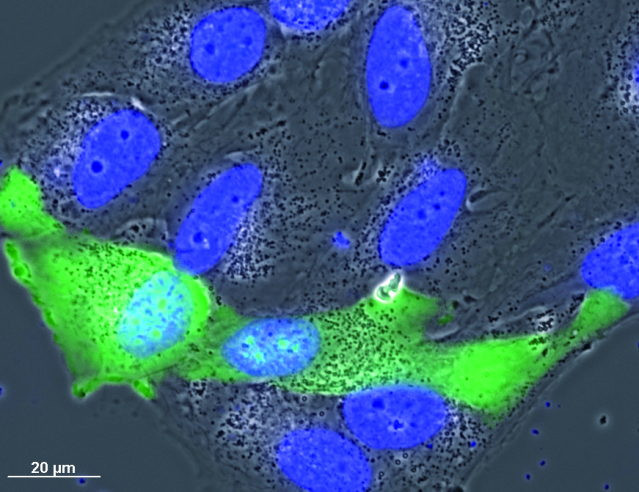
With the development of fluorescence technology, although this imaging method and fluorescence imaging can be performed at the same time, the existence of the phase difference ring affects the transmittance of fluorescence, which is not conducive to the imaging of weakly fluorescent samples.
(5) Polarizing microscope (PO)
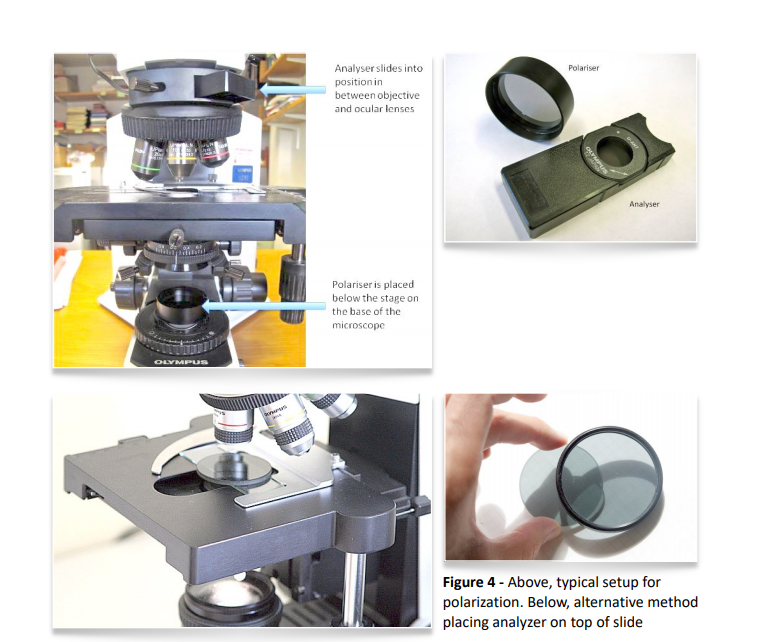
The top two images show a typical polarizer setup, with the polarizing plate inserted into the objective and eyepiece in a fixed position (pointed by the arrows). An alternative, shown in the next two images, is to place polarized lenses directly on the glass slide
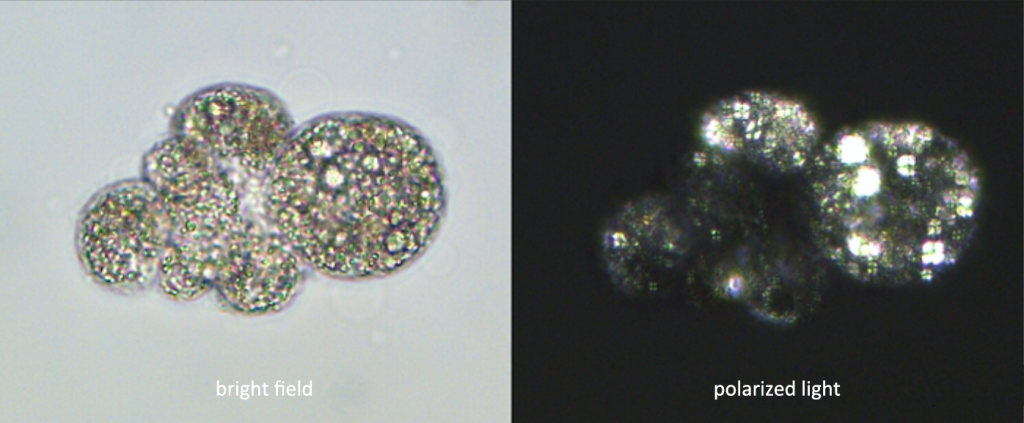
Comparison of lipid components contained in cells and the phenomenon of “Maltese cross” in the polarized light field of view
Polarizing microscope is used to detect birefringent substances, such as filaments, spindles, collagen, chromosomes, etc. The difference from ordinary microscopes is that there is a polarizer (polarizer) in front of the light source, so that the light entering the microscope is polarized light, and there is an analyzer (a polarizer whose polarization direction is perpendicular to the polarizer) in the lens barrel. The stage of this microscope can be rotated. When a single refraction substance is placed on the stage, no matter how the stage is rotated, since the two polarizers are vertical, no light can be seen in the microscope, and the put When entering a birefringent material, the object can be detected by rotating the stage because light is deflected as it passes through the material.
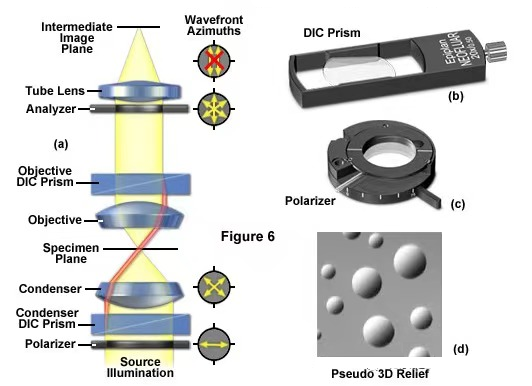
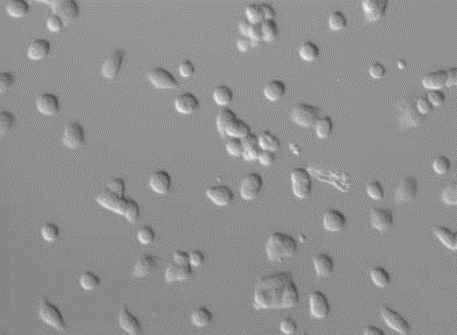
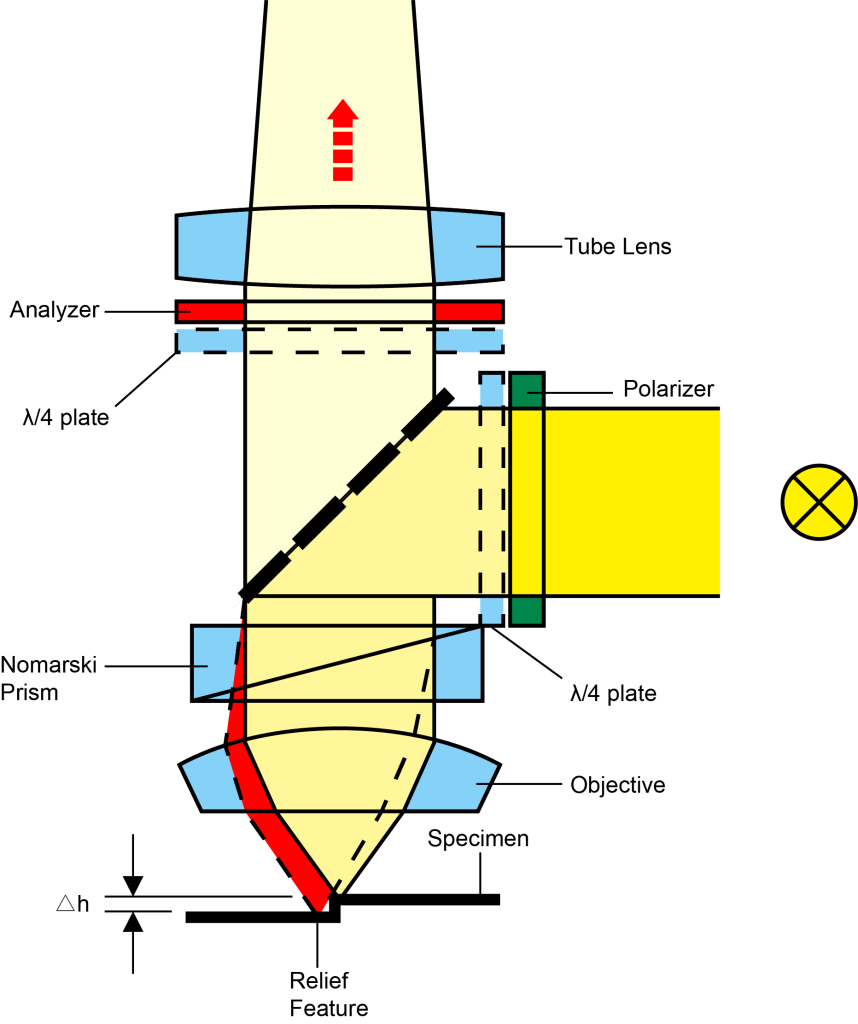
(6) Differential interference contrast microscope (DIC)
Differential Interference Interference (DIC) is a more complex observation method. The optical path includes not only polarizing components, but also a set of special prisms to amplify small differences in sample thickness gradients and refractive indices. For example, lipid bilayers can produce excellent contrast in DIC due to the difference in refractive index between the aqueous and lipid phases of the cell.
In addition, adherent mammalian and plant cells that are relatively flat, including plasma membranes, nuclei, vacuoles, mitochondria, and stress fibers, often have pronounced gradients at their cell boundaries that are readily imaged by DIC.
In plant tissue, although the birefringent cell wall reduces the contrast of DIC to some extent, it can still show the nuclear membrane, tonoplast membrane, some mitochondria, chloroplasts and condensed chromosomes in epidermal cells. Compared with phase contrast, the imaging effect of DIC can avoid the halo of the cell edge.
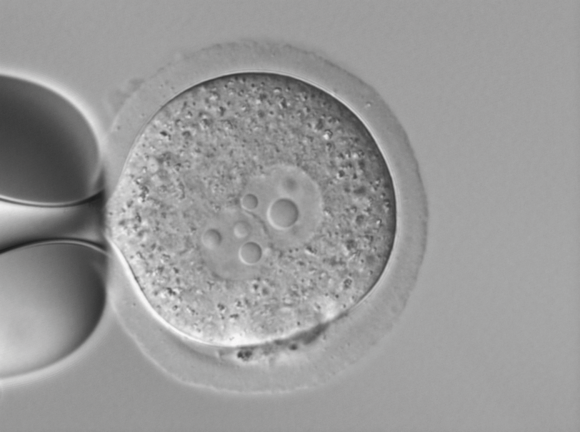
Differential interference imaging makes the sample have a three-dimensional effect, and the effect is more intuitive, but its optical path accessories are complex and difficult to adjust. Since differential interference is based on the principle of polarized light, samples with high birefringence or samples embedded in birefringent materials are not suitable for differential interference observation.
For example, differential interference cannot be used to observe samples in plastic dishes, but plastic dishes are suitable for cell culture, and Zeiss’ unique PlasDIC method can be used to observe live cells in plastic dishes by differential interference interference.
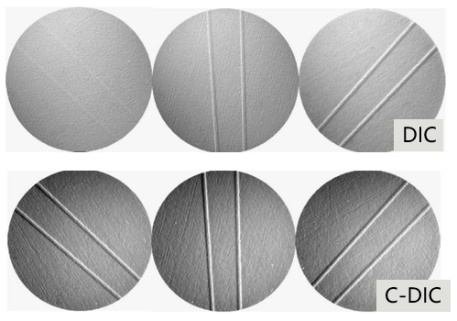
For material samples, the differential interference interference (DIC) observation method is becoming more and more important and popular. But for those materials with multi-directional structures, DIC can no longer meet the observation requirements. Zeiss circular differential interference can image the 360-degree oriented structure on the sample at one time because it replaces linearly polarized light with circularly polarized light, avoiding cumbersome sample rotation.

(7) Confocal laser scanning microscope (CLSM for short)
A major limitation of conventional epi-fluorescence microscopy is the inability of the camera to distinguish interfering light that is out of focus. If the sample is thick and densely stained, or if ideal 3D images are desired, this out-of-focus interference light can obscure valuable information.
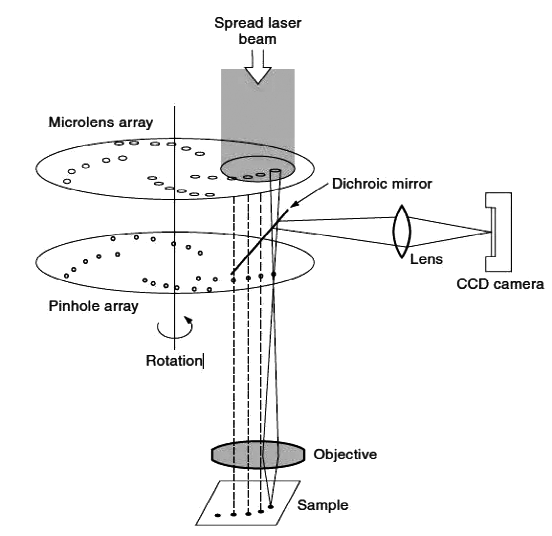
A point light source is used to irradiate the specimen, and a well-defined small light spot is formed on the focal plane. The fluorescence emitted by this point is collected by the objective lens, and sent back to the beam splitter composed of dichroic mirrors along the original irradiation light path. The beam splitter sends the fluorescence directly to the detector. There is a pinhole in front of the light source and the detector, respectively called the illumination pinhole and the detection pinhole. The geometric size of the two is the same, about 100-200nm; relative to the light spot on the focal plane, the two are conjugate, that is, the light spot passes through a series of lenses, and finally can be focused on the illumination pinhole and the detection pinhole at the same time. In this way, the light from the focal plane can be converged within the scope of the detection hole, while the scattered light from above or below the focal plane is blocked outside the detection hole and cannot be imaged. The laser scans the sample point by point, and the photomultiplier tube after detecting the pinhole also obtains the confocal image of the corresponding light point point by point, which is converted into a digital signal and transmitted to the computer, and finally aggregated into a clear confocal image of the entire focal plane on the screen .
Each focal plane image is actually an optical cross-section of the specimen, and this optical cross-section always has a certain thickness, also known as an optical thin section. Since the light intensity at the focal point is much greater than that at the non-focus point, and the non-focal plane light is filtered out by the pinhole, the depth of field of the confocal system is approximately zero, and scanning along the Z-axis can realize optical tomography, forming a Observe the two-dimensional optical section at the focused spot of the sample. Combining the X-Y plane (focal plane) scanning with the Z-axis (optical axis) scanning, the three-dimensional image of the sample can be obtained by accumulating two-dimensional images of continuous layers and processed by special computer software.
That is, the detection pinhole and the light source pinhole are always focused on the same point, so that the fluorescence excited outside the focal plane cannot enter the detection pinhole.
The simple expression of the working principle of laser confocal is that the laser confocal microscope breaks away from the field light source and local plane imaging mode of the traditional optical microscope, and uses the laser beam as the light source. On the sample, scan every point on the focal plane of the sample. If there is a fluorescent substance that can be excited in the tissue sample, the fluorescence emitted after being excited will directly return to the beam splitter through the original incident light path, and focus first when passing through the detection pinhole, and the focused light is detected by the photomultiplier tube (PMT) Collect and send the signal to the computer, and display the image on the computer monitor after processing.
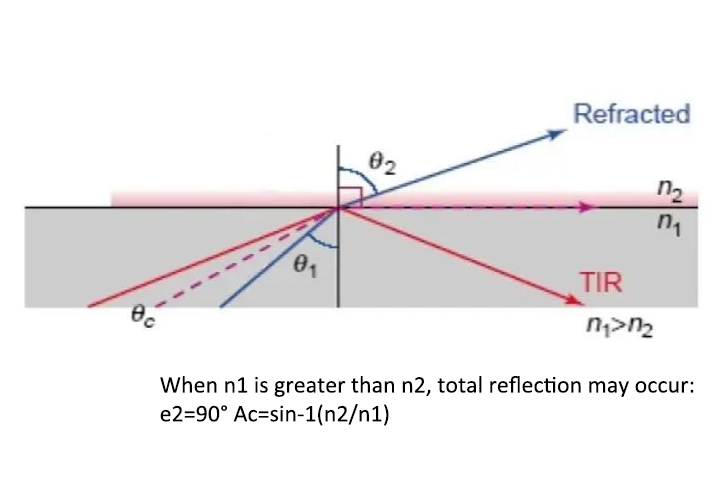
(8) Total Internal Reflection Fluorescence (TIRF) Microscope
Due to the influence of the far-field diffraction effect of the pupil, the traditional optical microscope has a resolution limit. Rayleigh summarized it as R≥0.61λ/nsin (u/2), where R is the resolution, λ is the wavelength of the imaging light, nsin (u/2) is the numerical aperture of the objective lens, that is, the NA value, and u is the aperture angle, so the spatial resolution limit of the optical microscope is ~250nm.
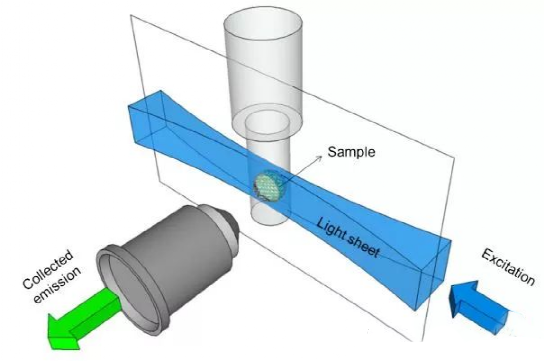
(9) Light sheet illumination microscope
Light-sheet illumination microscopy illuminates the sample with a thin sheet of light perpendicular to the image plane, exciting fluorescence only at the focal plane or in the immediate vicinity. This selective illumination also reduces the total exposure of the sample, thereby reducing photobleaching and phototoxicity. The images are fused to form a 3D image, which improves the Z-axis resolution compared to other microscopes.
(10) Super-resolution Microscopy (STED)
Principle of STED: Briefly, the basic principle of STED is to use a second laser (the STED laser, which produces a ring laser) to suppress the fluorescence emission of fluorophores located outside the excitation center (Figure 1). This suppression is achieved through a process of stimulated emission: when an excited-state fluorophore encounters a photon that matches the energy difference between the excited and ground states, it can return to the Ground state. This process effectively depletes the fluorescence emission capability of the excited fluorophore.
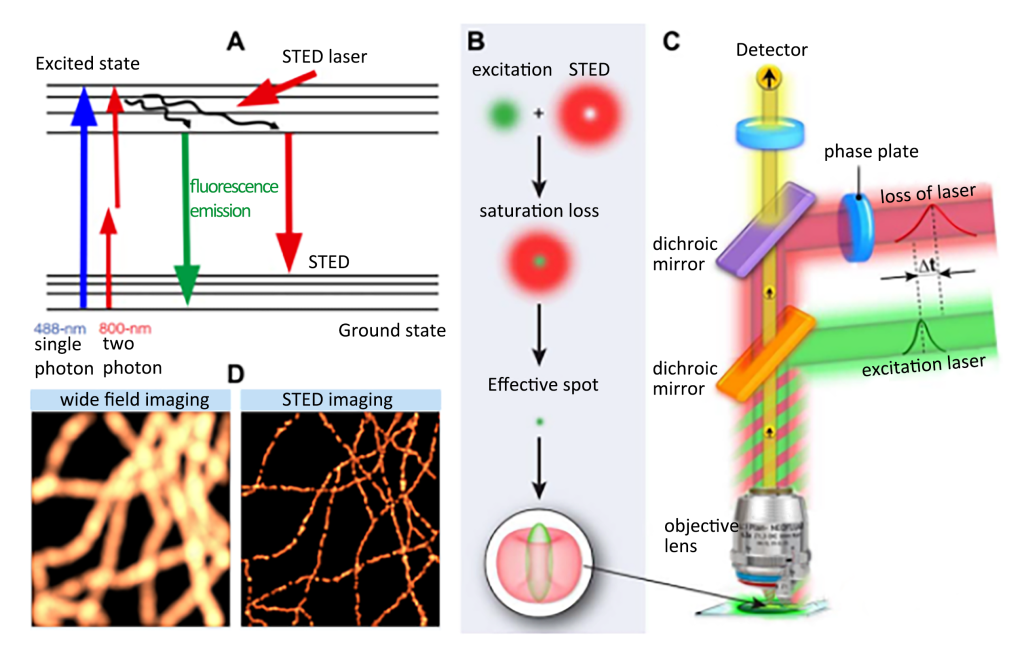
(A) Stimulated emission of fluorescence and annihilation of STED; (B) Observed in the X-Y plane, a “donut” shaped STED laser is applied, and its central zero point overlaps with the maximum value of the excitation laser focus; with saturation loss, the zero point In the area outside the vicinity, the fluorescence is suppressed, so that the size of the effective spot is greatly reduced; (C) Schematic diagram of the optical path structure of the STED microscope; the excitation laser and the STED laser are combined and focused into the sample through the objective lens, and the phase plate is placed in the optical path of the STED laser in order to generate a specific pattern at the focal point of interest; (D) Comparison of microtubules resolution in wide-field and STED imaging modes
STED microscope was originally modified on the basis of confocal microscope, so it has good compatibility with confocal and multiphoton imaging techniques and is widely used in biopsy detection. The corresponding fluorescent chemical groups for STED imaging need to have high photostability and a large stimulated emission cross-section, and the preferred emission spectrum ranges from the visible to the near-infrared. By 2016, the minimum resolution scale of STED imaging on the X-Y plane was close to 20 nm, which is 1/10 of the theoretical resolution limit due to diffraction.