1. Principle of stochastic optical reconstruction microscopy
Stochastic optical reconstruction microscopy (STORM) is a new physical method that applies fluorescence spectroscopy and microscopic analysis technology to single molecules. It is a new microscopy technology with a resolution more than 10 times higher than that of traditional optical microscopes. By combining individual High-precision positioning information of fluorophores in three dimensions and multiple colors is used to reconstruct super-resolution images.
N-STORM uses very low-intensity light to randomly activate a relatively small number of fluorophores. This random “activation” of fluorophores allows for the temporal separation of individual molecules, enabling high-precision Gaussian fitting of each fluorophore image in XY. By utilizing special 3D-STORM optics, N-STORM can also position individual molecules along the Z-axis with high precision. Super-resolution 3D images can be generated by computationally combining three-dimensional molecular coordinates.
2. Structural components of stochastic optical reconstruction microscope
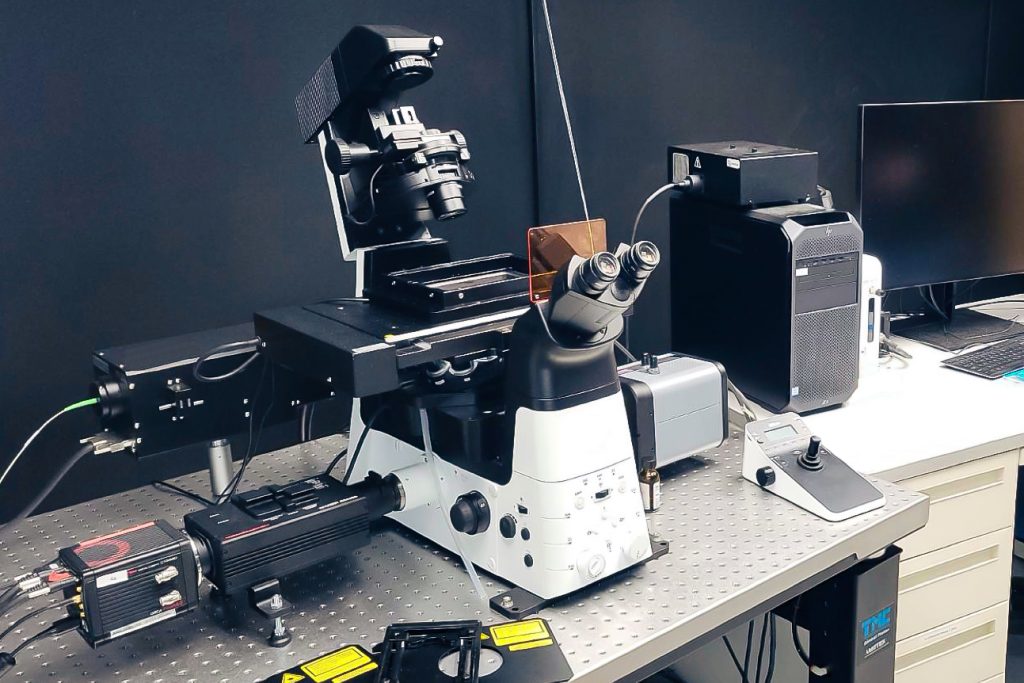
The basic setup of STORM is very similar to that of a conventional widefield fluorescence microscope, with some modifications. In this section, the main components of the microscope are described along with an outline of the experimental procedures.
Microscope components
Microscope frame and objective lens
The schematic diagram of the STORM microscope is shown in the figure below. Although the microscope frame is not a required component, we find it convenient to mount our microscope on a standard inverted fluorescence microscope frame. The microscope frame and sample stage should provide a stable mounting for the sample and objective lens, and the focusing mechanism must also be relatively stable. Because the raw data used to generate STORM images are collected over a period of time, sample drift during measurements reduces image resolution and must be corrected for in post-processing. At the nanometer scale, microscope drift is unavoidable, but any measures taken to minimize drift will improve image quality, such as thermal and mechanical isolation of the microscope.

(A) The microscope is based on a standard inverted fluorescence microscope. Laser sources are combined into a single beam that is expanded and focused into the back focal plane of the microscope objective. The translation stage allows adjustment of the incident angle of the illumination light. The detected light passes through the emission filter and is imaged onto a CCD camera. The specific laser wavelengths shown here are examples of activation and imaging wavelengths that may be useful for STORM. Depending on the choice of photoswitchable dye or fluorescent protein, other wavelengths may be required. Cylindrical lenses (CL) are used only for astigmatic imaging in 3D STORM applications. (B) Geometry of the focus locking system. An infrared (IR) laser beam is projected through the objective from a second dichroic mirror (not shown in Figure A). The beam reflects from the sample-coverslip interface and returns through the objective to a quadrant photodiode (QPD) where its position is detected.
Drift in the focusing mechanism is particularly problematic because this effect is difficult to correct for during analysis. We use an active focus locking system based on a weak infrared laser beam that passes through the objective, reflects from the sample-coverslip interface, and is projected onto a quadrant photodiode (QPD) as shown in Figure 4B. The position of the beam on the diode reports any relative motion between the objective and sample, and this signal is fed back to the piezoelectric z-stage to correct for motion.
Objectives should be selected to maximize light collection efficiency and minimize aberrations and background fluorescence. We typically use oil immersion lenses, such as the Olympus UPlanSAPO 100×NA 1.4 microscope objective, which supports epi-fluorescence-type and objective-type total internal reflection fluorescence (TIRF) illumination. Other similar objectives can also be used.
lighting geometry
For cell imaging, the through-objective illumination geometry (above) is convenient, allowing cell culture plates to be imaged from below so that cells remain in solution during imaging. This approach also allows the use of short working distance high numerical aperture objectives, significantly improving light collection efficiency.
To bring the illumination light to the sample, a dichroic mirror is used to combine the imaging and activation lasers into a single path, which is then expanded and collimated using a beam expander. This beam is focused into the back focal plane of the objective. The translation stage allows the beam to move toward the edge of the objective so that light from the objective reaches the sample at a high incidence angle close to but not exceeding the critical angle of the glass-water interface. In this way, a few micron-thick areas of the sample are illuminated by the angled beam. For thinner areas of the sample, adjusting the angle of incidence can achieve a narrower depth of illumination and lower background fluorescence. For imaging near the cell surface, the incident angle of the illumination light can be adjusted to be greater than the critical angle to allow total internal reflection and further reduce background signal.
Inspection optics and CCD cameras
Since STORM relies on the detection of single fluorescent molecules, the optical detection path of the microscope should be optimized for maximum light collection efficiency, and the CCD camera must be suitable for low-light fluorescence imaging. In our experiments, we used a thermoelectrically cooled camera using electron-multiplying CCD (EMCCD) technology, a form of on-chip signal amplification that boosts the signal to levels well above CCD read noise and dark current levels.
Select the degree of image magnification to achieve optimal fluorophore localization. If the magnification is too low, the image of the fluorophore is smaller than the camera pixels and sub-diffraction limit position information cannot be determined. If the magnification is too high, the photons collected from the fluorophore are spread over many pixels, and the noise generated when reading out each pixel reduces localization accuracy. According to research by Thompson and colleagues, the localization process is most accurate when the magnification is chosen such that the FWHM size of the PSF image is equal to ∼2.4 camera pixels.
In order to relate STORM data to actual distances, image magnification must be carefully calibrated. For example, the system can be calibrated by imaging a micrometer slide with a pattern of lines spaced 10 µm apart.
For 3D STORM imaging, a long focal length cylindrical lens is inserted before the camera as the final optic. This is discussed further in the section below.
light source
Laser illumination enables efficient excitation of fluorophores and adds the ability to use spectral filters to block excitation light from entering the detection channel, thereby maximizing the detection of fluorescent signals and minimizing background. For Cy5 or Alexa Fluor 647 imaging, a ∼650 nm laser source with a power output >50 mW is sufficient to achieve short switching times and rapid data collection. Higher laser power enables faster fluorophore switching, allowing for faster data collection rates. When imaging photoactivatable fluorescent proteins such as EosFP, a laser source of similar intensity at wavelength 561 or 568 nm can be used.
One or more additional lasers can be used to activate switchable fluorophores. As mentioned above, polychromatic photoswitchable activator-reporter pairs can be activated using various laser wavelengths (e.g., 405, 457, or 532 nm) when the activator dyes are Alexa Fluor 405, Cy2, or Cy3, respectively. For photoactivated fluorescent proteins, 405 nm is the most commonly used activation wavelength.
Finally, the addition of a conventional mercury arc lamp enables users to quickly image standard fluorophores such as DAPI (4′,6-diamino-2-phenylindole), GFP, or from Cy3–Cy5 labeled samples before starting STORM Cy3 signal data acquisition.
Electronically controlled laser shutter or acoustic-optic modulator
A system for turning laser illumination on and off in synchrony with data acquisition allows the activation of switchable fluorophores at predetermined times. This facilitates multicolor STORM imaging using fluorophores activated by light of different wavelengths. If the laser exposure time is synchronized with the camera’s frame rate, data analysis software can keep track of which frames of recorded data correspond to which lighting color. In this way, the time at which a fluorophore switching event occurs in a data set can be related to a specific activation wavelength. Fast switching of laser illumination can be achieved by an acoustic-optic modulator (AOM), an acousto-optic tunable filter (AOTF) or a mechanical shutter. To synchronize laser switching with CCD exposure, the clock signal provided by the CCD camera can be used as a timing source to control the AOM, AOTF, or shutter.
computer control
When recording STORM data, a computer equipped with a multifunction data acquisition card continuously records image data from the camera and streams it directly to disk. The computer also switches the laser modulator/shutter in synchronization with the camera frame based on preset laser pulse sequences and interfaces with the QPD and piezoelectric stage controllers to maintain sample focus.
Laser intensity control
STORM imaging requires a device for controlling laser intensity, especially the activation laser intensity. As mentioned above, the fraction of activated fluorophores must be kept low enough so that the images of individual fluorophores generally do not overlap. To achieve this condition, the intensity of the activation laser must be adjusted. Neutral density filter wheel provides convenient coarse adjustment of laser intensity. Fine-tuning can be done by passing the laser light through a half-wave plate and then through a polarizing beamsplitter cube. Rotating the waveplate rotates the laser polarization, which in turn modulates the amount of light that passes through the beam splitter. Intensity control can also be provided by AOM or AOTF.
3. Functions of stochastic optical reconstruction super-resolution microscopy
- Ultra-high resolution imaging
- Multi-color imaging
- Ultra-high resolution 3D imaging
- Total internal reflection ultra-high imaging
- Analyze the relationship between multiple proteins
- Analysis of subcellular structure
4. Advantages of stochastic optical reconstruction super-resolution microscopy
(1) Ultra-high resolution imaging
Vertical resolution up to 50nm
- N-STORM also uses a proprietary method to improve the axial resolution of conventional optical microscopy tenfold and provide three-dimensional nanometer information.
- The 3D overlay feature enables capturing multiple 3D-STORM images from different z-axis positions and merging them into a single image to create a thicknessed STORM image.
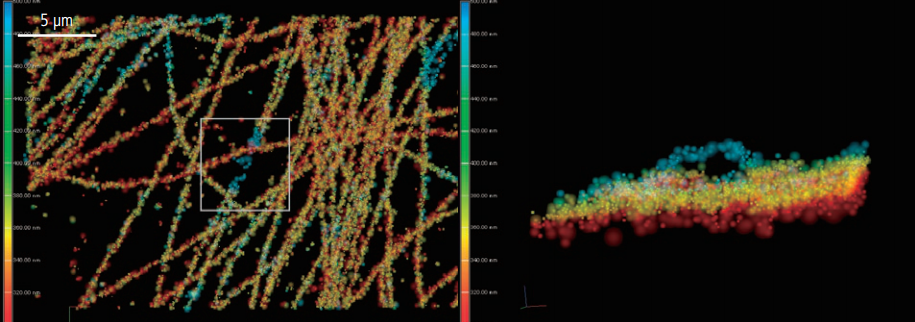
DNA with 3D-STORM.
Photo courtesy of: Jason Otterstrom, Ph.D., Melike Lakadamyali, Ph.D., The Institute of Photonic Sciences (ICFO), Castelldefels, Spain
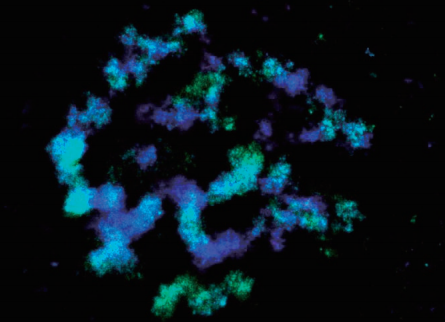
3D-STORM image of EdU-labeled DNA in Drosophila melanogaster neuroblast
Photo courtesy of: Anna Oddone, Ph.D., Melike Lakadamyali, Ph.D. group, The Institute of Photonic Sciences (ICFO), Castelldefels, Spain
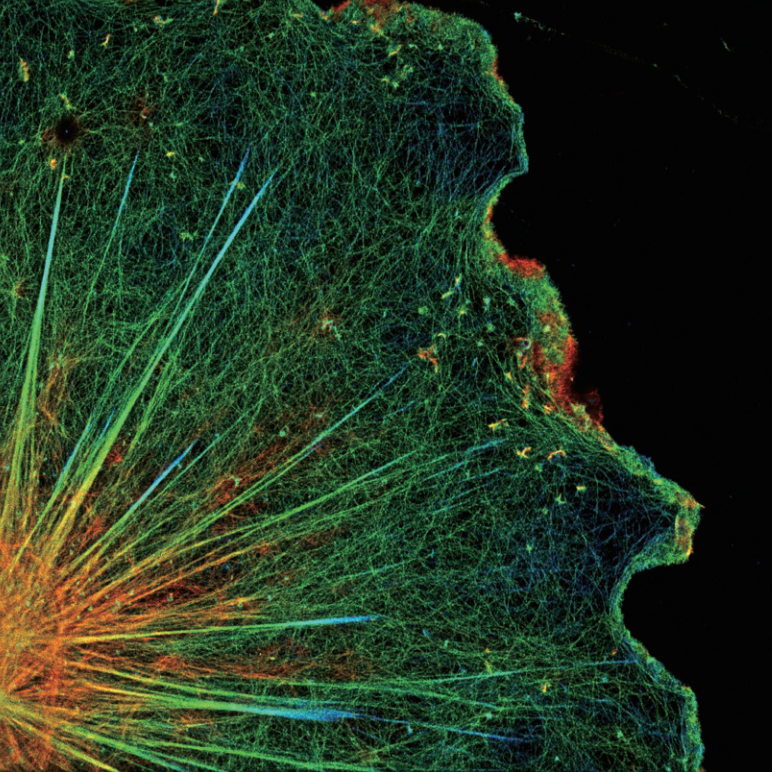
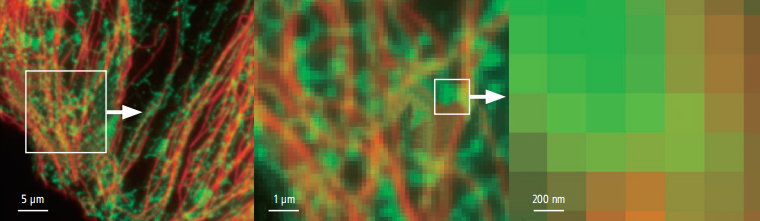
Lateral resolution can be as high as 20nm
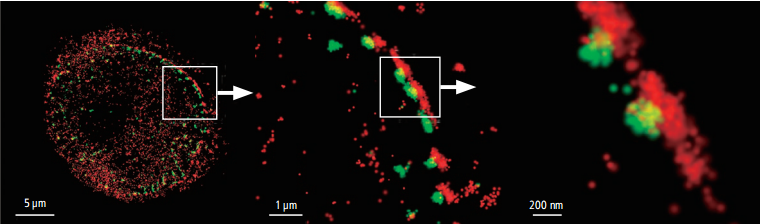
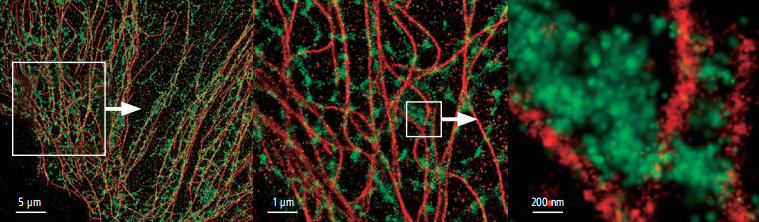
·N-STORM uses high-precision amplification information from thousands of fluorophores in the field of view to create stunning “super-resolution” images with 10 times the spatial resolution of traditional optical microscopy.
N-STORM images
Conventional widefield images
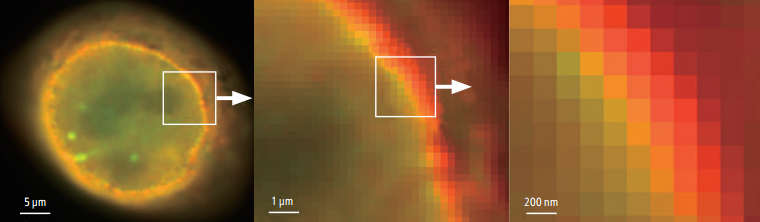
Photos courtesy of: Dr. Michael W. Davidson, National High Magnetic Field Laboratory, Florida State University
N-STORM images
Conventional widefield images
Photos courtesy of: Dr. Michael W. Davids on, National High Magnetic Field Laboratory Florida State University
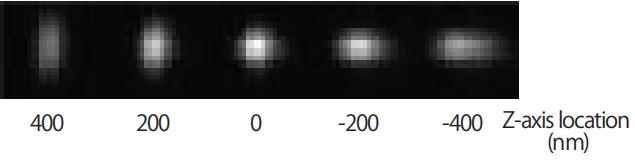
(2) Ultra-high-resolution three-dimensional imaging
Using a cylindrical lens that focuses the beam asymmetrically in the x or y direction, the z-axis molecular position can be determined with an accuracy of approximately 50 nm. A three-dimensional image result with a thickness of 800nm can be obtained in one shot.
Single spot image
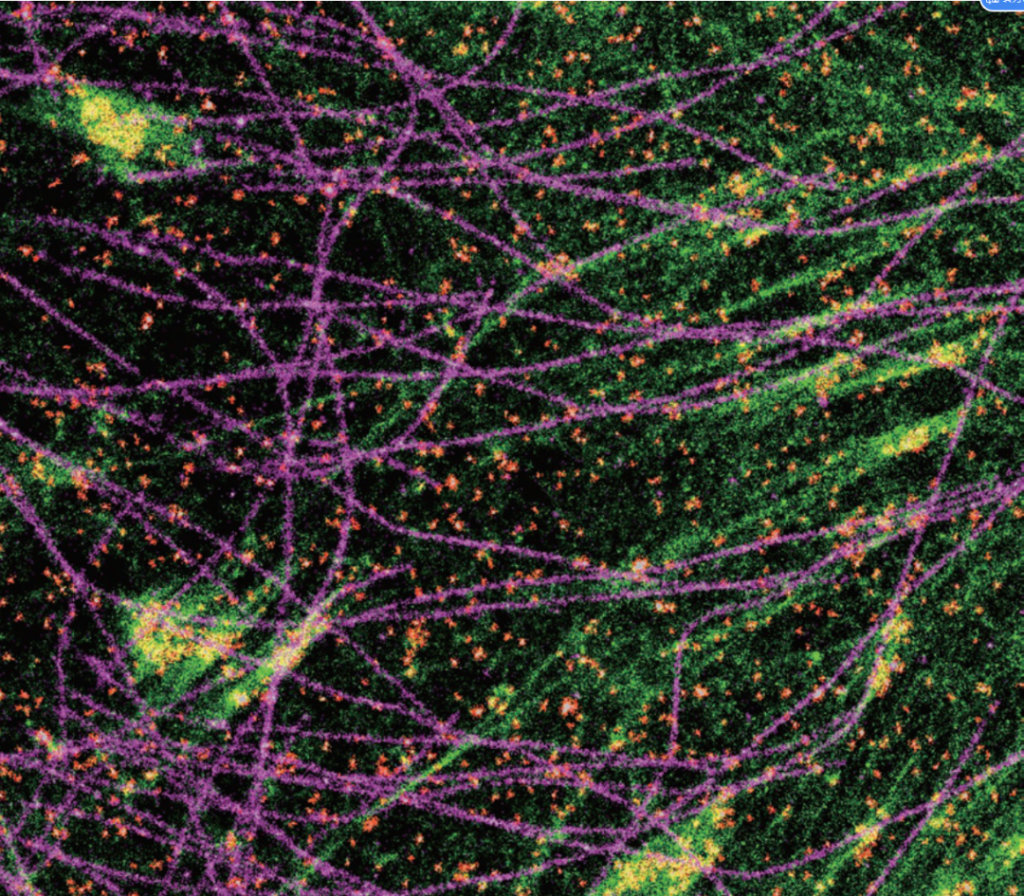
(3) Multi-color imaging capability
Multicolor resolution imaging is possible using either activator-reporter combinations for sequential activation imaging or activator-free tags. This flexibility allows users to easily gain insights into properties such as localization and interactions of multiple proteins at the molecular level.
(4) Total internal reflection ultra-high imaging TIRF
By adjusting the incident angle of light, the total internal reflection phenomenon is obtained, which can image at a 100nm thin layer, greatly filtering out non-focal plane imaging information.
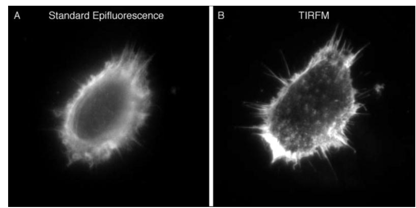
After labeling the HELA cells, use the same 100x oil lens to image. The right side is the image after using the TIRF function. The structure on the cell surface is clearer, but the non-structural levels will not be imaged. (Kenneth N. Fish 2009)
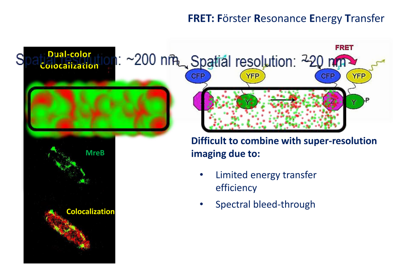
(5) Analyze the interaction between multiple proteins
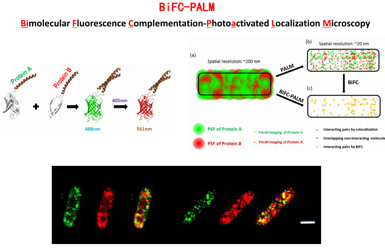
Liu et al., Nat Comm 2014
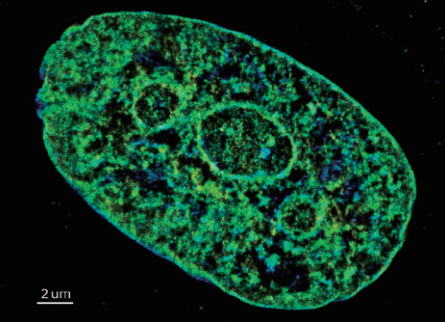
(6) Analysis of subcellular structure
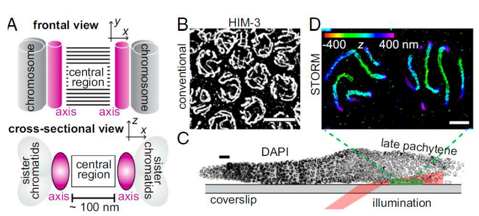
Structural elucidation of the cell division synaptonemal complex (Kohler, S., et al 2017)