1. Interpretation of scanning electron microscope pictures
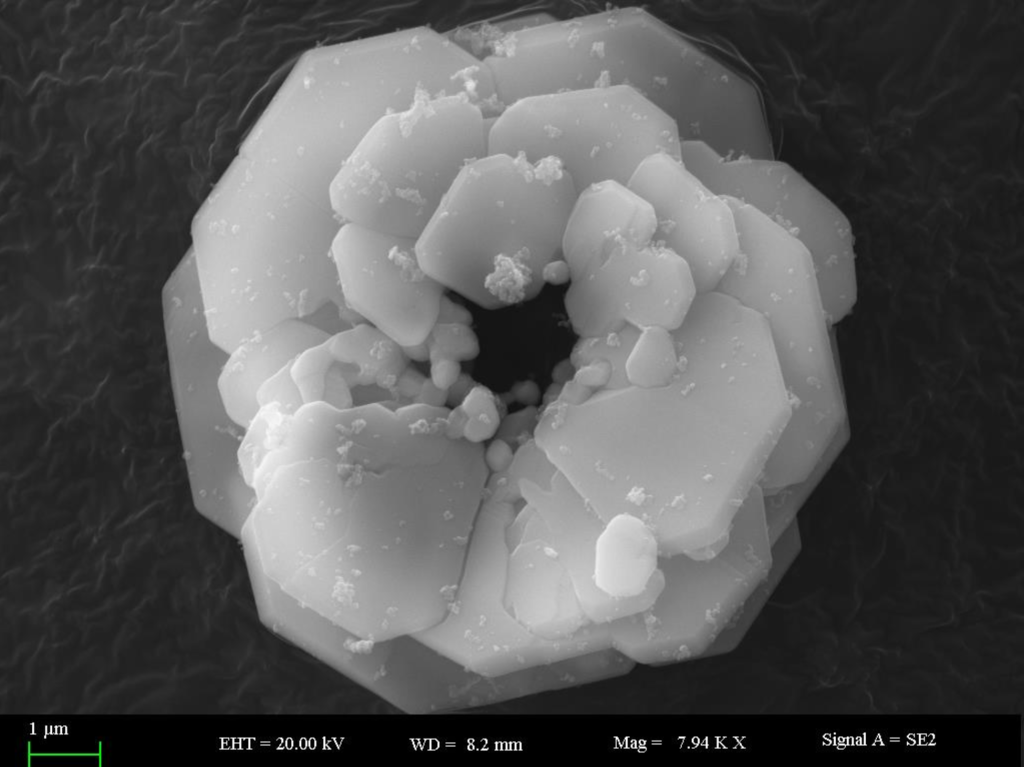
Figure 1 SEM image display, EHT=20.00kV means accelerating voltage 20kV; WD=8.2mm means working distance 8.2mm; Mag=7.94KX means magnification 7940 times; Signal A=SE2 means SE2 detector.
There are many parameters of the SEM, all of which can be displayed in the toolbar below the picture, but the most direct and critical factors to determine the image quality are the four types of accelerating voltage (EHT), the working distance (WD), magnification (Mag) and detector. Therefore, the detection results of this scanning electron microscope only choose to display these important indicators.
2. Interpretation of electron microscope parameters
2.1 Accelerating voltage
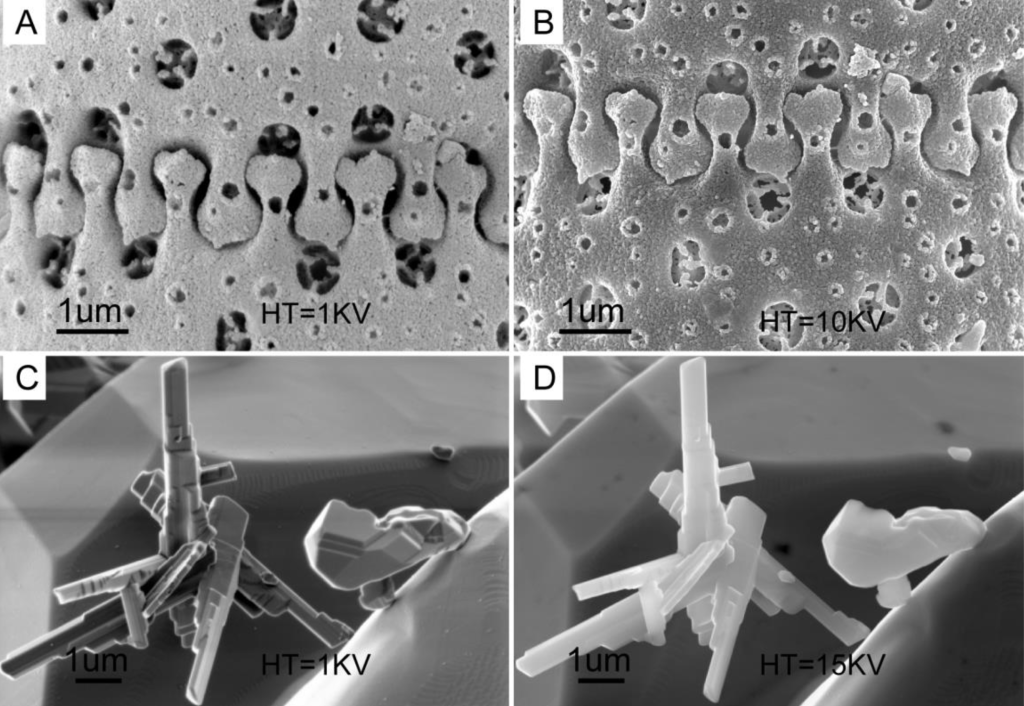
Figure 2 Secondary electron images under different accelerating voltage conditions. A and C are images under the condition of 1KV accelerating voltage, and the details of the image surface are clear. B is the image under the condition of 10KV accelerating voltage, and the edge effect of the image is strong. D is the image under the condition of 15KV accelerating voltage, and the surface details of the image cannot be seen.
Generally, the higher the accelerating voltage, the higher the image resolution. When the sample has good conductivity and is not easily damaged by the electron beam, a high accelerating voltage can be selected. At this time, the energy of the electron beam is large, the penetration of the sample is deep, and the contrast of the material is reduced. , the image resolution is increased.
But the accelerating voltage is too high, the penetration ability of the electron beam to the sample is too large, the information on the surface of the sample is missing, and the sample looks like jade, as shown in Figure 2D.
When the acceleration voltage is low, the energy of the incident electrons is low, and the depth of interaction with the sample is relatively shallow, which can better reflect the information of the outermost layer of the sample, and is conducive to the observation of the surface morphology of the sample (Fig. 2A, C); in addition, the low acceleration voltage can Effectively reduce charging phenomenon and make it easier to observe non-conductive samples.
As shown in Figure 2B, the edge of the sample is too bright under the acceleration voltage of 10kV, indicating that a large amount of charge has accumulated here, while the same part photographed with the acceleration voltage of 1kV in Figure 2A has no obvious charging phenomenon.
Therefore, only by flexibly selecting the accelerating voltage according to one’s own requirements can an ideal electron microscope image be obtained. When it is necessary to observe the surface information of the sample, the conductivity of the sample is poor, and the thermal stability of the sample is poor, it is necessary to choose a lower, or even ultra-low, accelerating voltage.
When it is necessary to obtain high-resolution images, organic contamination on the surface of the sample, or phase composition information inside the sample, it is necessary to select a higher accelerating voltage.
2.2 Working distance
The working distance (WD) is the distance from the pole piece under the objective to the sample surface. When the working distance increases, the beam spot on the sample becomes larger and the resolution decreases, but the aperture angle decreases and the depth of field increases.
At the same time, the large working distance can realize extremely small magnification imaging and the magnification can reach dozens of times (Figure 3).
Usually, the working distance can be selected within the range of 2-45mm. When observing high-resolution images, a working distance of less than 5mm can be selected to cooperate with the inlens detector of the machine; when observing rough fracture surfaces or larger plant samples, a working distance of more than 10mm can be selected to obtain a larger depth of field.
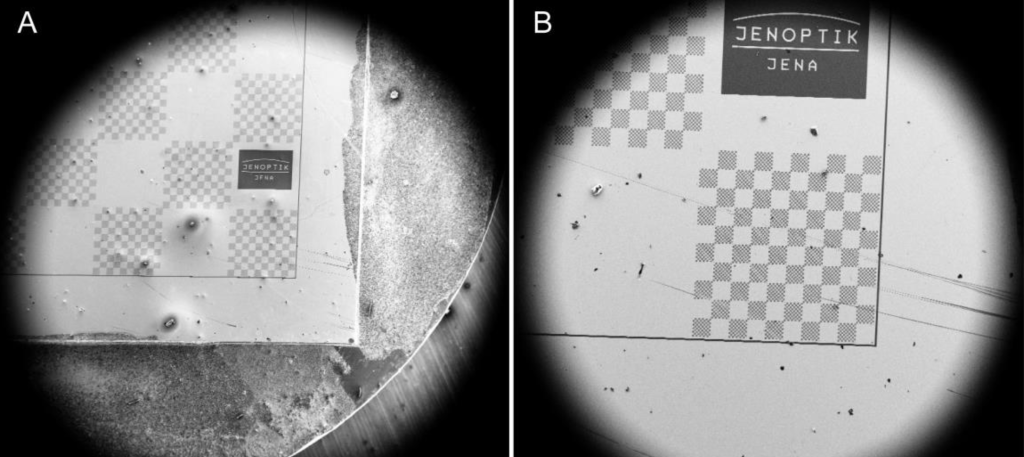
Fig. 3 Minimum magnification pictures of secondary electron images under different working distance conditions
2.3 Types of detectors
Both SE2 and Inlens are secondary electron detectors for sample morphology detection. ASB detectors are backscattered electron detectors for elemental contrast imaging.
2.2 Working distance
Scanning electron microscope magnification – reflects the ability range of the change of the coil magnetic field to control the size of the electron beam scanning area, and is the linear ratio between the image display size and the size of the electron beam scanning area of the sample.
As expressed by M, if the length of the sample is L, the information on the straight line will be imaged at L on the picture tube. In terms of length, the magnification factor is:
M=Lc/Ls
Almost all scanning electron microscopes now use digital cameras to take pictures. Each manufacturer defines the magnification differently.
There are also many magnification display methods on each instrument. For different instruments, the area seen under the same magnification is not necessarily the same size.
At this time, you need to look at the ruler, and the length of the ruler on all instruments is the same.
For the same instrument, if the operator does not adjust the magnification display method, the photos taken at the same multiple are absolutely consistent in size.
But sometimes at the same magnification, the displayed scale is different. For example, sometimes a 5000 times photo shows a 1um scale, and sometimes a 2um scale, but the length displayed by the scale is absolutely proportional.