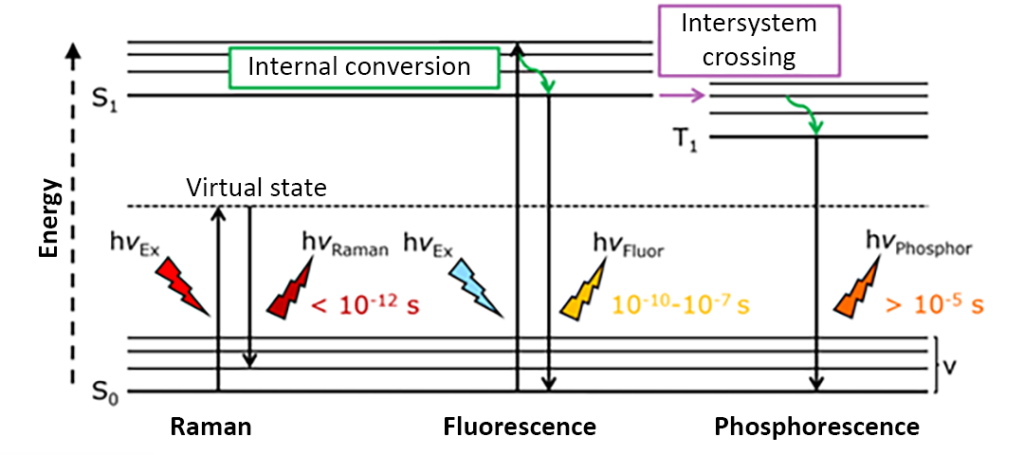
In a confocal spectrometer, it is advantageous to combine multiple complementary spectroscopic techniques to maximize the information produced by a single sample. Two widely used confocal spectroscopy techniques are Raman and photoluminescence (PL) imaging, which provide vibrational and electronic energy level information of a sample by reading wavelength-dependent spectra. Both techniques can be performed on a confocal Raman spectrometer equipped with a continuous wave (CW) laser and a charge-coupled device (CCD) detector.
Another powerful imaging technique is fluorescence lifetime imaging (FLIM) or phosphorescence lifetime imaging (PLIM). In FLIM/PLIM, changes in the fluorescence or phosphorescence lifetime of a sample are imaged. Lifetime imaging can be used to determine chemical changes in the fluorophore/phosphor microenvironment, detect conformational changes, and characterize properties such as charge carrier efficiency in semiconductor materials and autofluorescence in tissues. Furthermore, unlike intensity, lifetime is independent of fluorophore/phosphor concentration. Therefore, it can be used to distinguish materials with overlapping emission peaks. Since FLIM/PLIM is a time-resolved method, it requires a pulsed excitation source, a photon-counting lifetime detector, and photon-counting electronics.
This technical note describes how to use the RMS1000 confocal Raman spectrometer to perform Raman, PL and PLIM imaging of samples within a single software package. The integration of these three imaging technologies into the RMS1000 makes it ideal for analyzing multiple sample types and for specialized in-depth study of individual samples.
§ Materials and methods
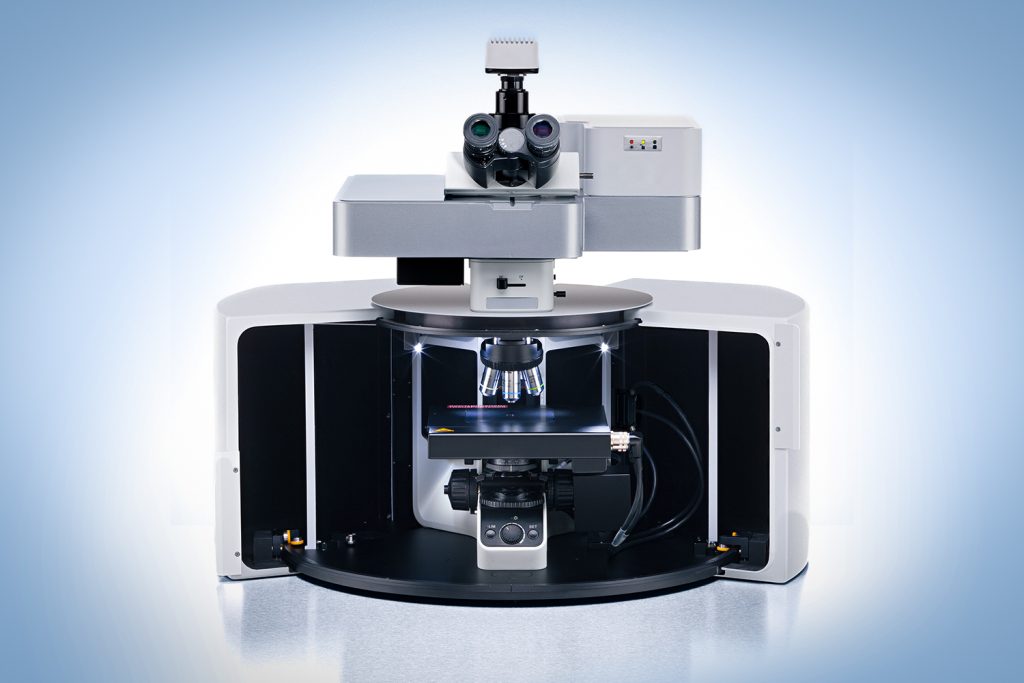
Two photoluminescent rare earth phosphors with different chemical structures and optical properties were mixed and deposited on calcium fluoride disks for spectral imaging. Raman, PL, and PLIM measurements were performed on particles of both phosphors using an RMS1000 confocal Raman spectrometer (Figure 2).
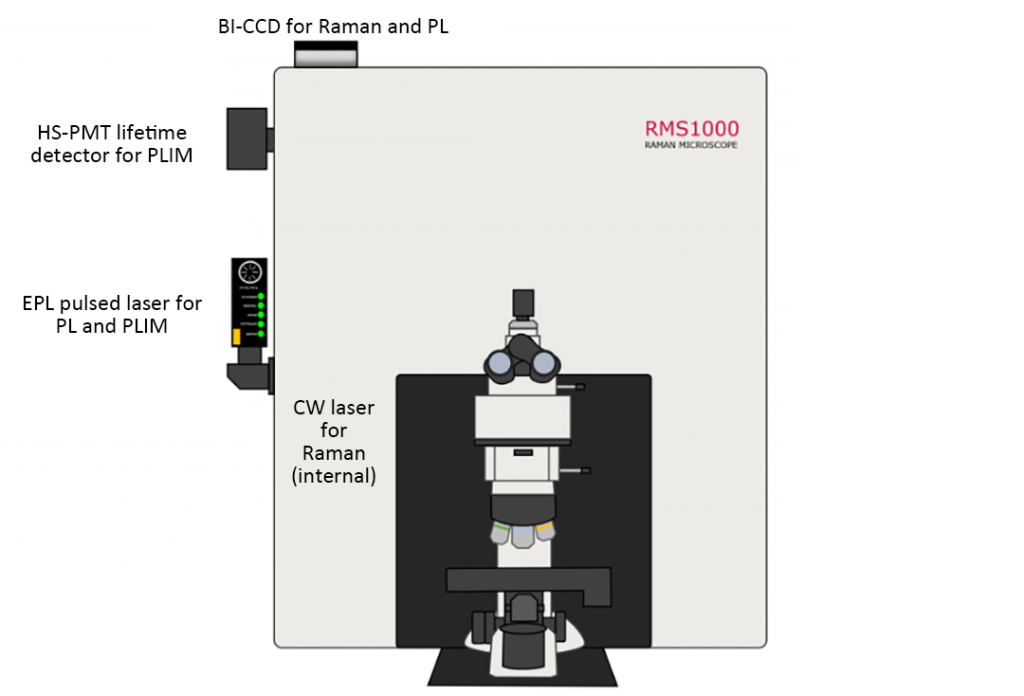
The schematic diagram in Figure 2 shows the relevant configuration of the confocal Raman spectrometer for each of the different imaging modes. For spectral PL and PLIM measurements, an externally coupled HPL-405 picosecond pulsed diode laser was used. For spectral PL, the laser was operated at 80 MHz and used as a quasi-CW excitation source, and the resulting PL emission was detected using a back-illuminated charge-coupled device (BI-CCD). For PLIM measurements, an HPL-405 laser is used at 10 kHz, along with fluorescence and phosphorescence lifetime electronics capable of time-correlated single photon counting (TCSPC) and multi-channel scaling (MCS), and high-speed photomultiplier tube (PMT) lifetime detection device. For Raman measurements, the system is equipped with an internal 785nm CW laser and BI-CCD. Table 1 summarizes the different excitation sources and detectors required for each mode. Implement three imaging modes and use Ramacle® software to select and change the optical components required for each mode.
| Imaging Mode | Laser | Detector |
| PL Spectral | CW or pulsed (quasi-CW) | CCD |
| PLIM | Pulsed | PMT |
| Raman | CW | CCD |
Darkfield imaging
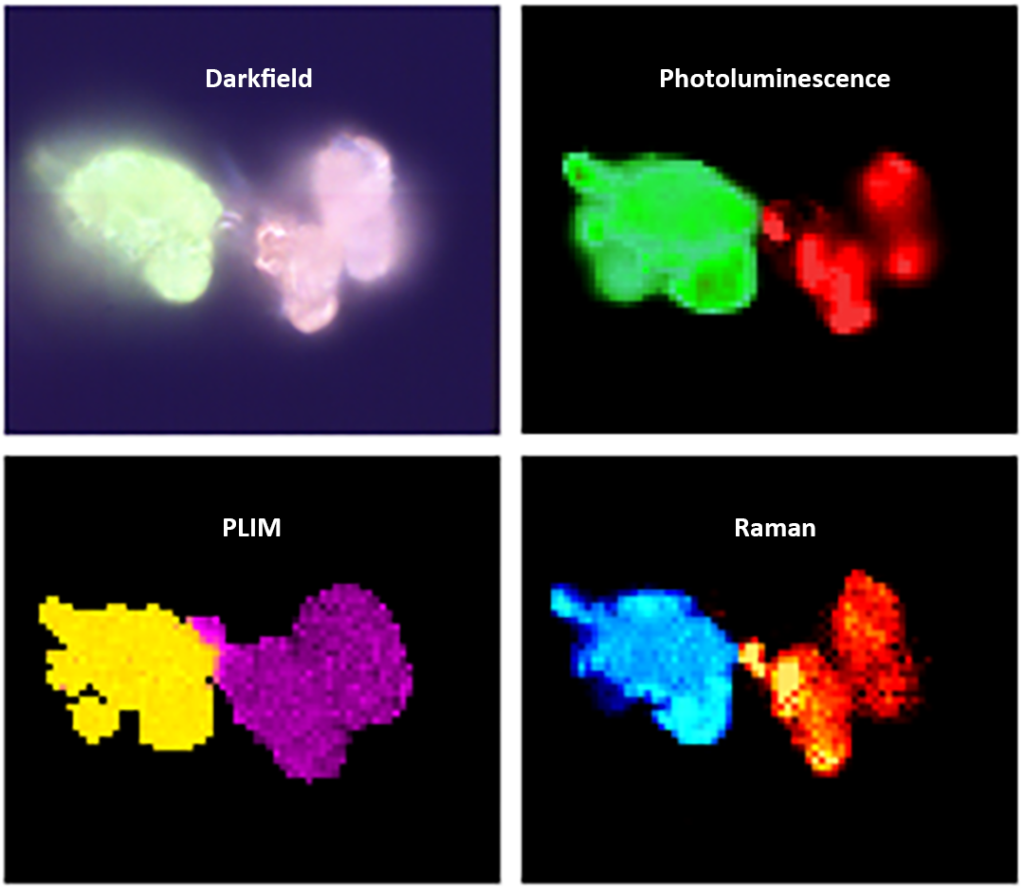
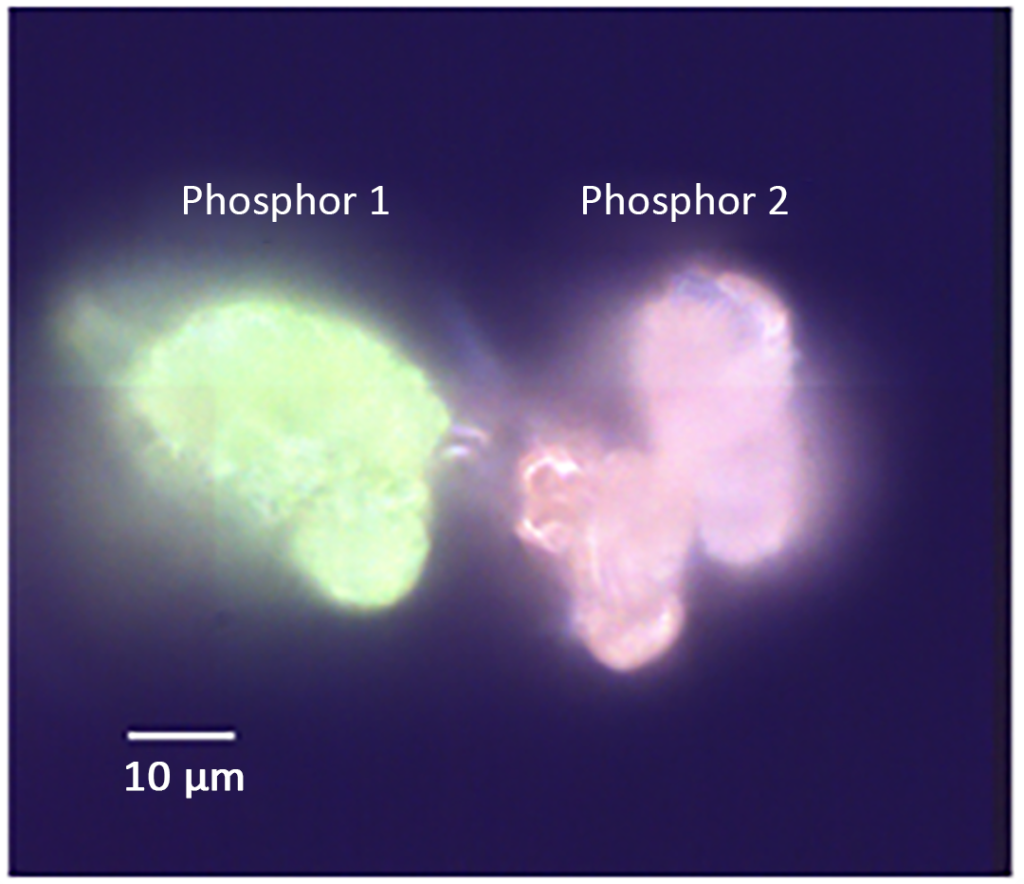
Darkfield imaging was used to identify areas containing both phosphor particles, as shown in Figure 3. Particles labeled Phosphor 1 and Phosphor 2 are visible under the microscope as they produce green and orange PL, respectively, when illuminated by white light. The area of the sample containing the two particles was then analyzed using PL, PLIM and Raman.
Photoluminescence (PL)
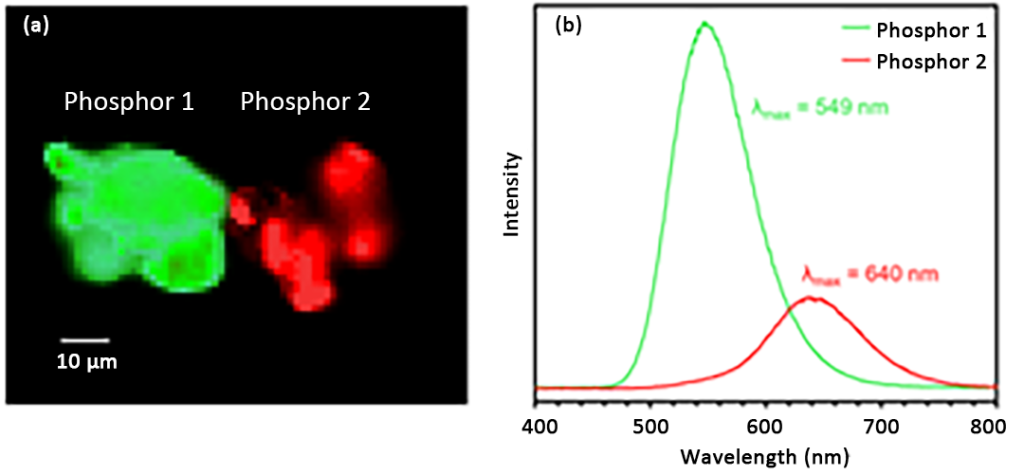
The first spectroscopic technique used to analyze samples was spectral PL imaging, as shown in Figure 4. The PL spectrum image shows the spectral intensity analysis of phosphors 1 and 2 with peak emission wavelengths of 549nm and 640nm respectively.
Phosphorescence lifetime imaging (PLIM)
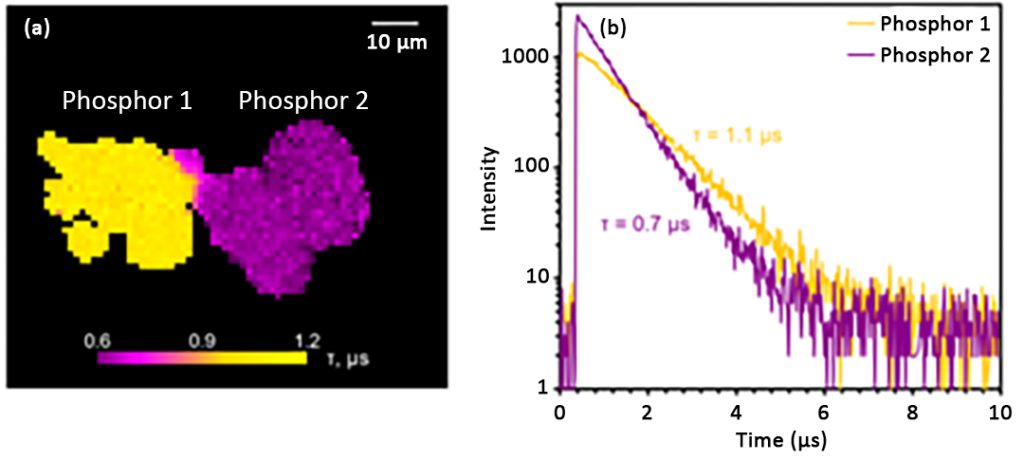
Next, the sample was subjected to PLIM imaging. Since the two particles produce PL spectra with different emission bands, the wavelength at which the two bands intersect (620 nm) was chosen for the lifetime measurement. The excitation rate was set to 10 kHz and the electronics module was set to record the decay in MCS mode. The PLIM image and corresponding attenuation in Figure 5 show that the lifetimes of phosphors 1 and 2 are approximately 1.1 μs and 0.7 μs, respectively. Therefore, in addition to distinguishing samples by PL emission wavelength, the RMS1000 can also be used to distinguish samples by lifetime.
Raman
Finally, in order to distinguish the two phosphors by their chemical structures, they were imaged using Raman spectroscopy, as shown in Figure 6. Since both phosphors exhibit PL at 549nm and 640nm, the 785nm laser was chosen to acquire Raman images. This ensures that the resulting spectrum is free of fluorescence background.
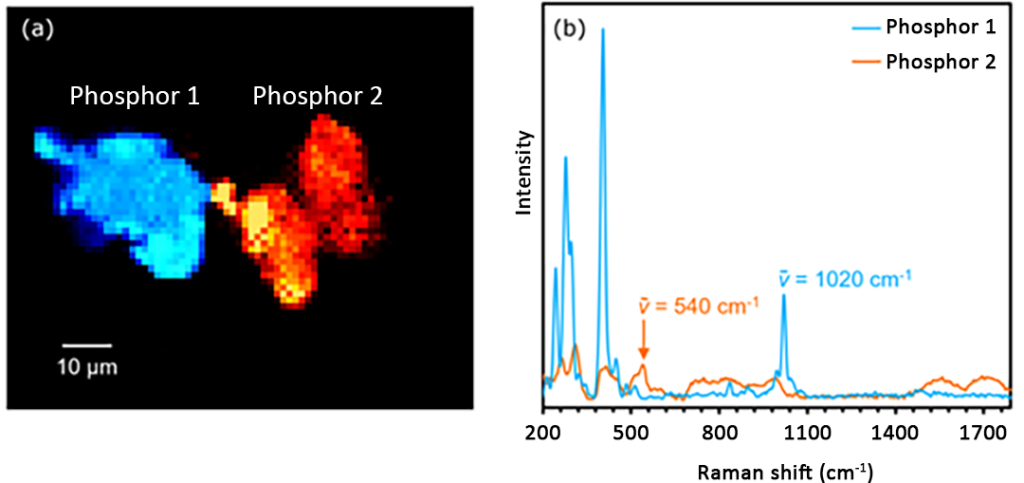
The Raman imaging and corresponding spectra in Figure 6 show that these two phosphors exhibit unique vibrational spectra and therefore have different chemical structures. Images of phosphors 1 and 2 were constructed by analyzing the intensity of the Raman peaks at 1020 cm-1 and 540 cm-1.
§ In conclusion
Using the RMS1000 confocal Raman microscope, spectral PL, PLIM and Raman imaging were used sequentially to fully characterize and differentiate two different phosphor particles, Figure 7. These techniques provide complementary information and therefore help to obtain a wealth of information and a comprehensive understanding of the sample.