§1 Abstract
Compared with other precision instruments, optical microscopy as a routine means of material characterization has been seriously neglected in the pharmaceutical and fine chemical industries. Optical microscopy undoubtedly plays an important role in sample preparation, but it can also play an important role in the study of solid properties.
The main purpose of this article is to correct this imbalance (for optical microscopy applications) and to illustrate that optical microscopy, especially polarized light microscopy, should have a place in most materials characterization.
The use of polarized light microscopy should not be limited to understanding the properties of the compounds under study; it should be an indispensable tool for solving difficult problems encountered in the discovery and development of organic and inorganic compounds to gain a comprehensive understanding of them. When a variety of techniques are used to study the solid properties of compounds, polarized light microscopy can be of great help in understanding and explaining phenomena discovered by other techniques. Simply observing a small sample at different magnifications can obtain valuable information that is unmatched by other non-optical instruments.
Polarizing microscopy itself is an independent and powerful technical means and should be the primary supplement to other solid-state characterization techniques such as XRD, thermal analysis, solid-state nuclear magnetic resonance, vibrational spectroscopy, etc.
This chapter focuses on the practical applications of polarized light microscopy and why it is a powerful adjunct to other tools.
§2 Why are optical microscopes used to study solid properties?
Microscopic observation aims to reveal information that is simply invisible to the naked eye by magnifying the sample image. When a polarizing filter is added to an optical microscope, it becomes an analytical tool that can be used to determine the optical properties of crystals and conduct microchemical experiments. Different solid structures have different optical properties, such as refractive index, color, extinction angle, and light dispersion, which can be quickly determined using optical crystallization methods. Optical properties are determined by the crystal structure and chemical properties of the crystal itself, so optical properties can provide a lot of valuable information to support data obtained by other methods. In addition, information such as particle size, particle properties, mechanical properties, twins, clathrates, crystal growth and ablation, mesogens, etc. can be quickly obtained through polarized light microscopy. By heating or cooling a small sample with a hot stage microscope, thermally induced phenomena such as melting point, crystalline transitions, solvates, and sublimation can be observed. In addition to optical microscopes, there are many other microscopes used to explore and analyze the materials and chemical properties of samples, such as electron microscopes equipped with X-rays, atomic force microscopes (AFM), infrared-Raman microscopes, near-infrared microscopes, and acoustic microscopes.
§3 Polarized light microscope
A polarizing microscope (Figure 1) is a compound microscope consisting of a polarizing filter placed above (analyzer) and below (polarizer) the specimen. The analyzer and polarizer are in orthogonal positions. The position of the polarizer in the optical path is always between the sample and the light source (usually integrated with the condenser) to ensure that the sample is observed through polarized light. The analyzer is placed in the optical path so that the sample can be detected with cross-polarization. The analyzers of some polarizing microscopes can be rotated so that samples can be examined under non-crossed polarization conditions or optically active samples can be characterized or special compensation plates can be used. In order to obtain a uniformly bright field of view the microscope must be adjusted (if possible) to Koler illumination conditions.
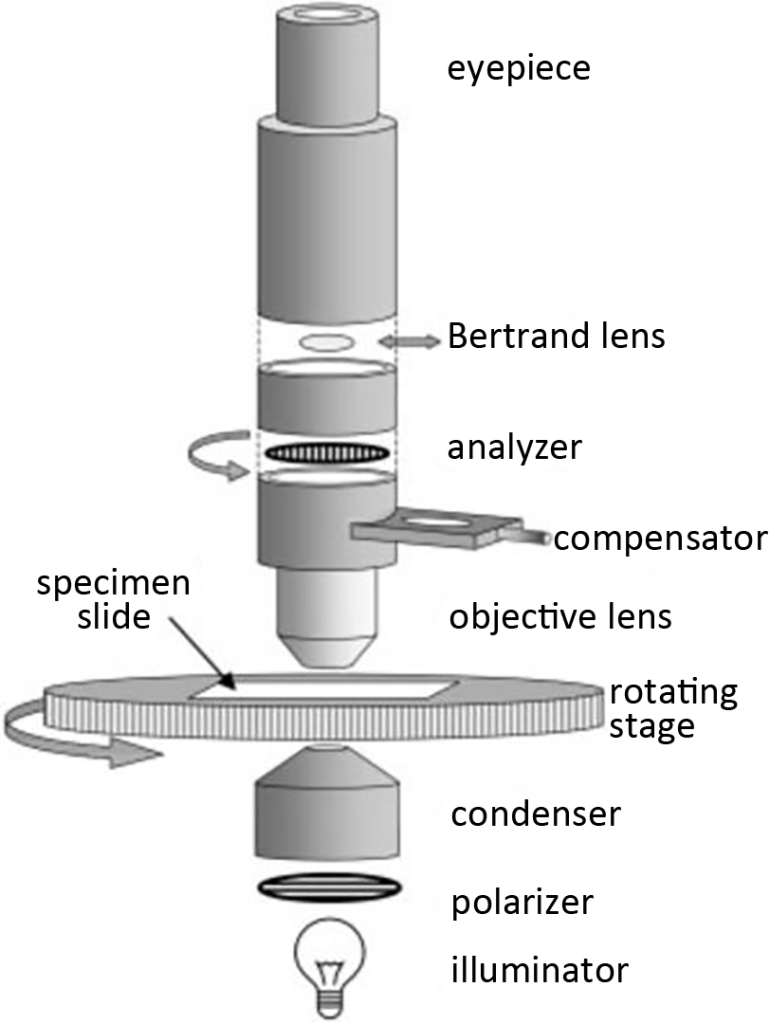
In order to ensure comprehensive observation of the sample under polarized light, the microscope must be equipped with a rotatable stage so that the individual crystals can be aligned with the vibration directions of the analyzer and polarizer respectively. At least one eyepiece must have crosshairs to indicate the direction of vibration of the analyzer and polarizer. There should be scales and verniers on the edge of the rotating stage to measure angles, such as the angle of a crystal face or the extinction angle of a crystal. A compensator (such as a hue plate) is a useful aid in determining other optical properties of the crystal and is generally installed in the optical path below the analyzer.
The polarizing microscope selected for studying the solid properties of crystals should have the following basic configuration:
- Upright stand to ensure light penetration
- Trinocular microscope lens (a pair of eyepieces and a lens used by a camera)
- High-density light source with adjustable light intensity aperture
- Graduated rotatable stage with vernier
- Concentrator equipped with aperture aperture
- Polarizer
- Analyzer (can be rotated or removed)
- Low, medium, and high-power eyepieces
- Threaded lens changer socket
- Eyepieces with reticle
- Eyepieces with accurate graduations
- Bertrand lens (retractable)
- Compensation plate (first-order red light plate)
- Camera
§4 Microphotography
Microphotography is the technique of recording images of small substances produced by a microscope. When examining a sample it is extremely useful to photograph the morphology it presents for reference or illustration in future reports. The camera is usually mounted on a pre-prepared trinocular lens or connected to one of the eyepieces through an adapter. With the birth of high-performance digital cameras, equipping them on microscopes has made microphotography easier and faster. However, obtaining an ideal result is also inseparable from the quality of sample preparation and the understanding and application of basic microphotography skills. Excellent performance (of the instrument) is only the prerequisite, and professional skills are the guarantee of quality. It is not enough to just state the magnification in the picture, there must also be a scale bar, because the original image will change due to the different size of the picture, but the scale bar is not affected by these factors. Because the size represented by the scale bar is determined by a stage micrometer or stage graticule with known accurate dimensions. Digital cameras specially used for microscopes generally have the function of automatic superposition of scale bars.
§5 Sample preparation
As with all analytical techniques, correct sample preparation is a prerequisite for valuable test results. Ideally, the sample should be sufficiently representative, and the state and properties of the sample itself should not be damaged in any way during the sample preparation process. Samples range from crystalline compounds to powders containing particles. The preparation of powder sample samples is relatively simple, just disperse it in a suitable liquid and spread it on a glass slide. But to prepare a rational sample, there must be a clear purpose from the beginning. For example, if you want to analyze the particle size of a sample, you must ensure that there is sufficient contrast between the sample and the background (how to measure it if you can’t see it). The contrast between the sample and the surrounding environment can be achieved by dispersing the sample in a liquid with a significantly different refractive index from itself. The refractive index of many organic solid materials is between 1.50 and 1.70. The refractive index of silicone oil is only 1.40 and is almost chemically inert, making it a rational carrier. Other liquids that can be used for dispersion include mineral oil, water, immersion oil, etc. A basic principle is that the dispersed sample is insoluble in the dispersing liquid. For a powder sample, the general sample preparation method is as follows:
- Add one or several drops of the selected dispersion onto a clean glass slide (samples containing larger particles require slightly more dispersion to fill the gap between the slide and the coverslip).
- Use a microsampler to load the sample onto the glass slide, and use circular or zigzag motion to disperse the sample evenly in the dispersion. Pay attention to the dispersion process without destroying the sample shape or generating bubbles.
- Cover the coverslip, starting at the smallest angle possible to avoid bubbles. The space between the cover glass and the slide should be filled with dispersion liquid, and the sample on one side will move between the gaps with the dispersion liquid, affecting the observation. At the same time, use lens cleaning paper or filter paper to wipe away excess dispersion around the edges of the cover glass to avoid contaminating the lens and stage.
§6 Observe using a polarizing microscope
The most valuable information on the optical properties of crystalline materials can often be obtained using polarized light microscopy. Whether pharmaceuticals, minerals, explosives, pesticides, pigments or ceramics, each crystalline form of matter has characteristic optical properties that can be used to identify it. Using a polarizing microscope, samples can be easily observed under different conditions without the need for other auxiliary equipment. These different conditions include: unpolarized light, plane polarized light, circularly polarized light, crossed polarizers, and non-crossed polarizers. They will be introduced below with practical applications.
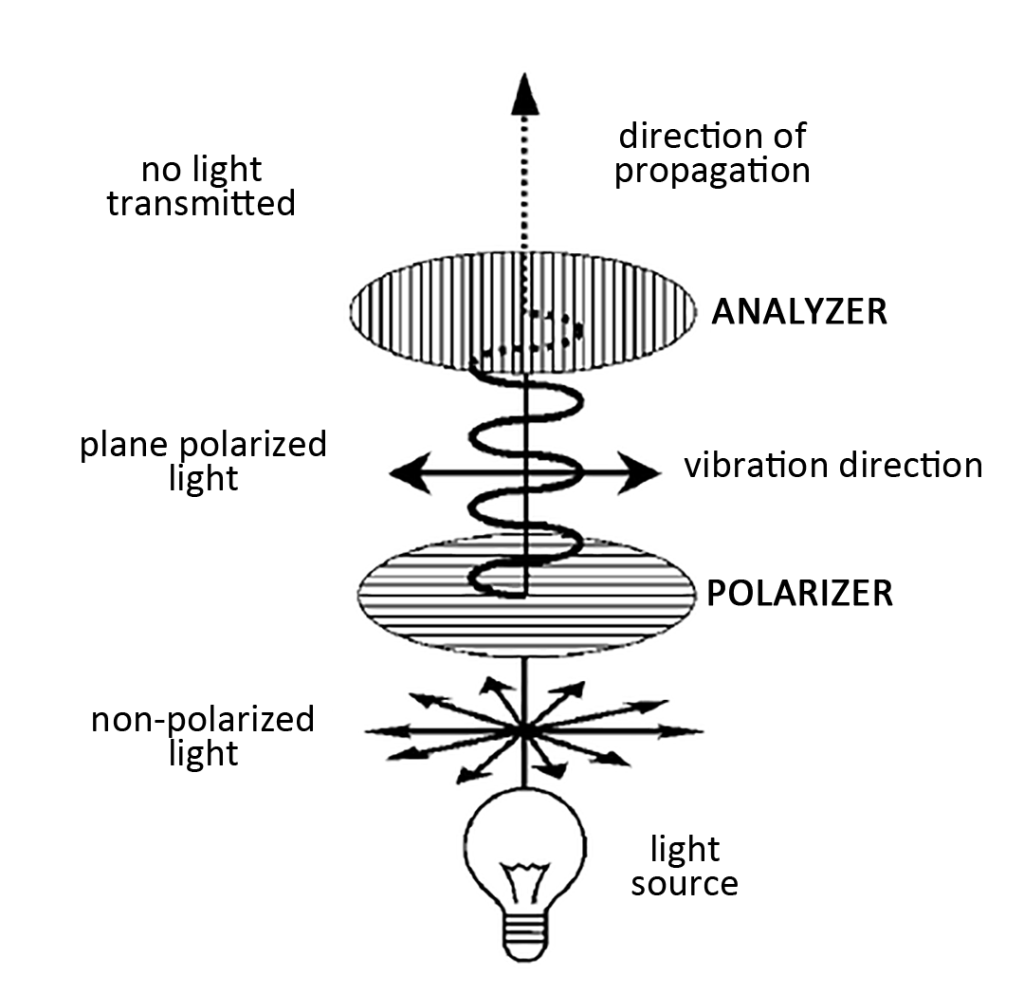
6.1. Polarized light
Light whose vibration direction and propagation direction are perpendicular in all directions is unpolarized light. Generally speaking, this kind of unpolarized light has no more use for crystalline materials other than observing particle size and properties. When unpolarized light encounters a polarizing filter, only light whose vibration direction is parallel to the filter grating can pass through and become plane-polarized light. When plane-polarized light reaches the analyzer directly (at a 90° angle to the polarizer), no light can pass through and the field of view is dark. This condition is called crossed polarizers.
6.2. Use plane-polarized light to study crystals
Since the vibration direction of plane-polarized light is known, the single crystal can be observed in different directions by simply rotating the stage. Plane-polarized light has two main applications:
- Position the anisotropic crystal compound through the direction of polarized light to determine its refractive index. If unpolarized light is used to measure the refractive index, the average value of the refractive index in each direction is measured. For isotropic crystals, there is no need to use plane-polarized light because the refractive index is independent of direction.
- Determine the absorption color of anisotropic crystal compounds in specific vibration directions. When a colored crystalline compound rotates under the irradiation of plane-polarized light, the color or intensity of the color changes, which is called dichroism or pleochroism. When viewed with non-plane polarized light the color is averaged in all directions.
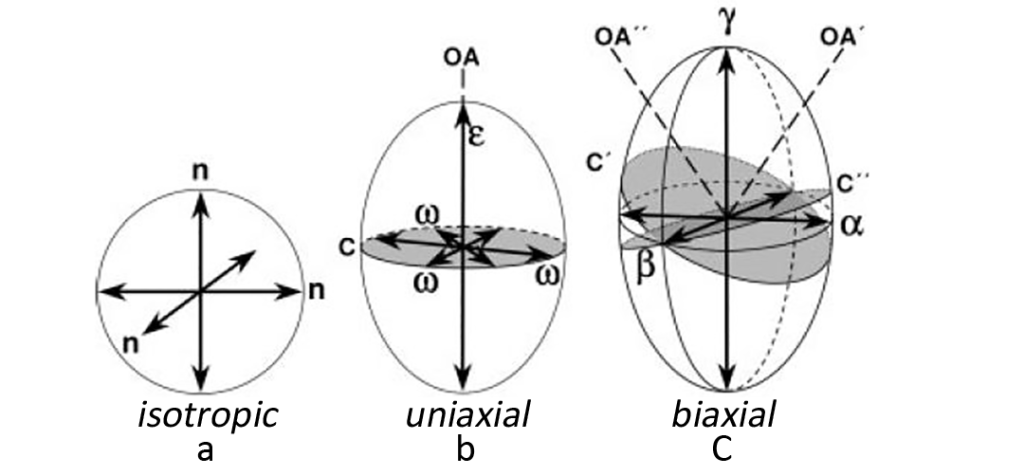
For an isotropic crystal (at a certain temperature and wavelength), light passes at the same speed in all directions, so an isotropic crystal has only one refractive index. Other anisotropic crystal compounds have two or three refractive indices. When polarized light enters an anisotropic compound, it will decompose into two mutually perpendicular vibration waves in both fast and slow directions depending on the propagation speed. When light waves in both directions pass through the compound, propagation in the slow direction is relatively delayed. A convenient way to account for refractive index in different directions is to construct a three-dimensional model called an index ellipsoid (indicatrix). The refractive index is displayed in the form of a radius, the length of which is proportional to the size of the refractive index. For isotropic substances, the refractive index ellipsoid is circular (Figure 3, a), because the refractive index is the same in all directions, and the only variable is the size, which varies with the refractive index.
For a substance with two refractive indices, the refractive index ellipsoid is a spheroid of revolution. Trigonal crystal system, tetragonal crystal system and hexagonal crystal system all have two ray axes, conventional and unconventional, and the corresponding refractive indexes are nω and nε respectively. Either direction of the two ray axes may be the direction of fast or slow propagation. The vibration direction of conventional waves is parallel to the optical axis of the crystal, showing isotropy. The propagation direction is spherical and has a circular cross-section (C). The vibration direction of unconventional waves is perpendicular to the C plane. The result of the combination of the two waves is that the refractive index ellipsoid takes the shape of an ellipsoid (Fig. 3, b). The only optical axis is OA perpendicular to the C section. A crystal with only one optical axis is called a uniaxial crystal.
Monoclinic crystals, triclinic crystals, and orthorhombic crystals have three mutually perpendicular ray axes, and the corresponding refractive indexes are α, β, and γ respectively. α has the smallest value (the fastest propagation), and γ has the largest value and the slowest propagation. Its refractive index ellipsoid is a three-axis ellipsoid (Fig. 3, c). There are two intersecting circular cross-sections C’ and C” in the triaxial ellipsoid, both with β refractive index as the radius. Each cross-section has optical axes A’ and A” perpendicular to it. The plane where the optical axes are located is called the optic axial plane, and this plane is also the plane where the ray axes corresponding to α and γ are located. A crystal with two optical axes is called a biaxial crystal.
The acute angle between the two optical axes is called the optic axial angle (2V), which is related to the refractive index and is a constant for the corresponding compound. For uniaxial crystals and biaxial crystals, there is a certain correspondence between the optical axis and the ray axis. For example, for the trigonal crystal system, tetragonal crystal system and hexagonal crystal system, the optical axis and the ray axis are coincident. For the orthorhombic crystal system, any optical axis can coincide with any ray axis. For the triclinic crystal system, any optical axis and The ray axes do not coincide.
6.3. Use polarized light to study crystals
When using plane-polarized light, if no sample is placed or the field of view is dark when an isotropic crystal sample is placed, for anisotropic crystals unless viewed from the optical axis direction or the sample is just in the extinction position, the sample will be birefringent due to birefringence. The phenomenal view will be bright. When using unpolarized light, isotropic and anisotropic samples can be observed at the same time. For anisotropic samples, the interference color and extinction position can also be observed, but the observation results at this time are different from those observed using orthogonal polarized light. The results are inconsistent, so non-orthogonal polarized light is only used to observe mixed samples and is generally not used to measure the optical properties of crystalline materials.
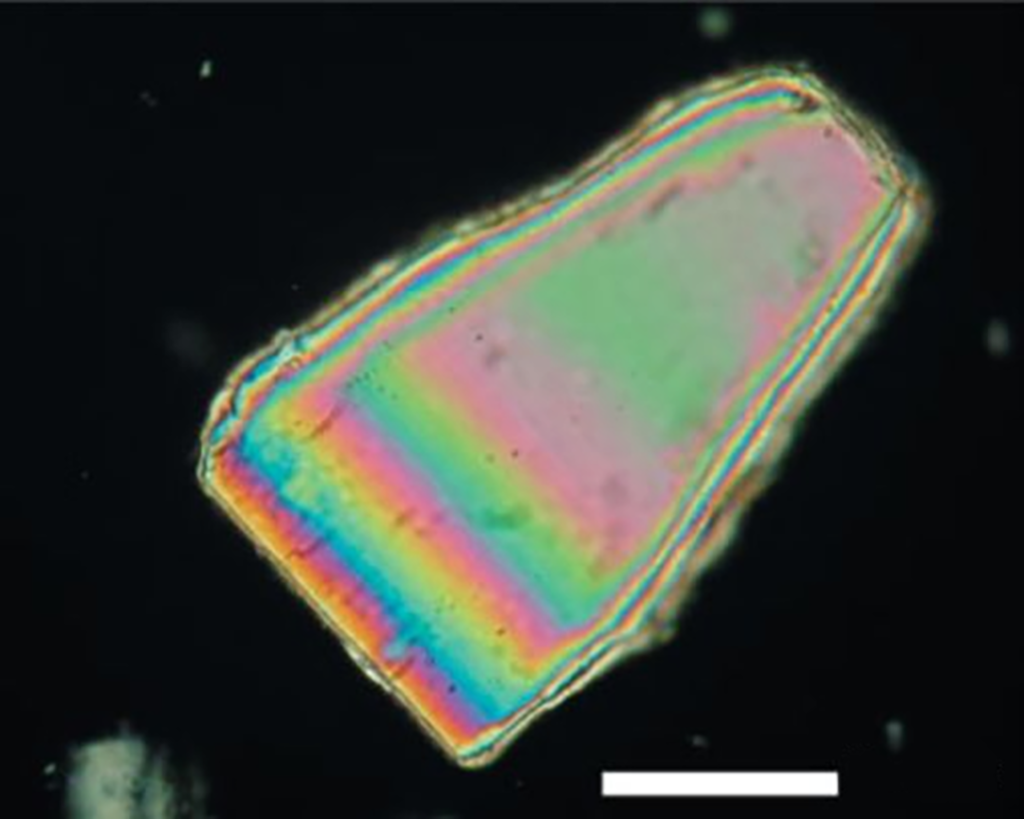
Interference Colors: Interference colors or polarization colors can be observed using orthogonal polarized light because the propagation of light in one direction lags behind the other direction during the propagation of light in anisotropic crystals. When the two directions It is caused by the process of deconstructing and reconstructing the light after passing through the crystal and then reuniting in the analyzer. Interference colors are divided into different color levels and are generally found on the bevels of edges. Low-level interference colors are often observed at thinner edges, with the color levels moving toward higher orders as the crystal thickness increases. Figure 4 is a polarized light picture of lactose monohydrate. The center is fifth-order green, and the second-order red can be observed at the edge. The color band in the crystal changes with the thickness of the crystal similar to the contour lines in the map. The closer the color band is, the “steeper” the crystal surface is.
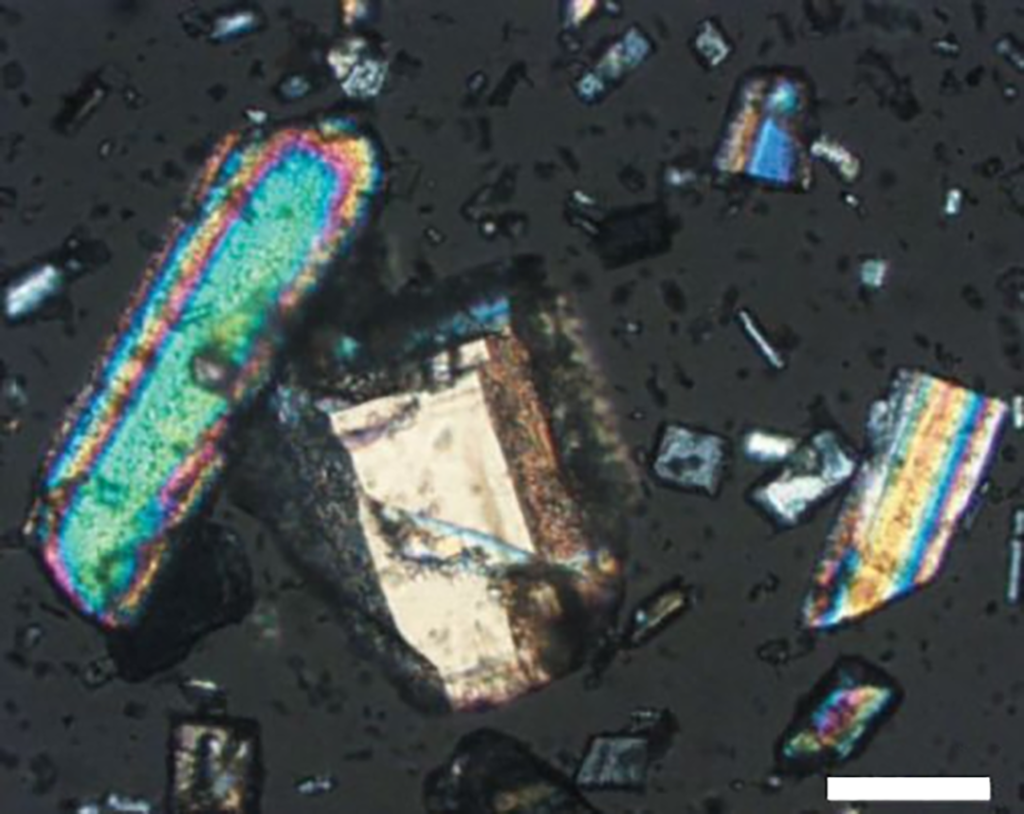
In addition to being related to the thickness, the interference color of the crystal is also related to the direction in which the crystal is observed. As shown in Figure 5, a series of different interference colors may be observed for compounds with randomly distributed directions. Therefore, relying solely on interference color cannot determine the direction of the crystal. Differentiate between different crystals.
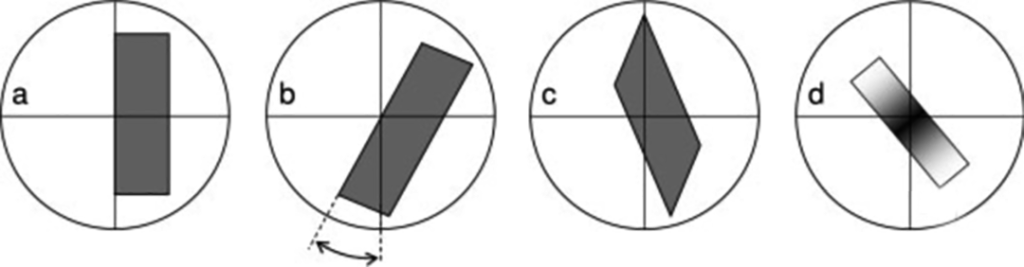
Extinction: When using orthogonally polarized light to observe a birefringent crystal, due to the extinction phenomenon, the field of view will darken once every 90° rotation of the stage. When extinction occurs, the direction of light vibration in the crystal and the polarizer or analyzer The orientation of the device is consistent (except for photoactive substances). The extinction angle is based on the crosshairs in the eyepiece. At this time, the position of the crosshairs must be strictly consistent with the polarizer and analyzer. When the relationship between the extinction position and crystal properties is determined, it can be used as a symbol of a specific crystal system.
As shown in Figure 6-a, when the extinction occurs on the longer side of the crystal and is parallel to the cross line, the extinction position at this time is straight extinction; as shown in 6-b, the extinction position is at a certain angle with the cross line. It is called oblique extinction (inclined or oblique extinction), indicating that the extinction angle generally does not exceed 45°; as shown in Figure 6-c below, when the extinction position occurs when the cross bisects the angle between two adjacent crystal planes, at this time It is symmetrical extinction; as shown in 6-d, when undulate extinction occurs, a black area can be seen moving on the surface of the crystal as the stage rotates, which generally occurs in crystals that are bent or under high tension. middle.
In addition, some crystals do not completely exhibit extinction, but undergo a change in interference color, which is called anomalous extinction (dispersed or anomalous extinction). The reason for this phenomenon is that the extinction positions of different interference colors are different. When a crystal has interference color but no extinction position, the crystal may be a polycrystal. When observed at a larger magnification, it can be seen that many crystals are in different extinction positions at any time; it may also be a twin, when one crystal face becomes extinct, the other crystal face does not become extinct.
§7 Refractive index
The refractive index of a sample will seriously affect the observability of the sample and can also be used to identify substances. It is one of the most important optical properties of a substance. Substance observability can be improved by increasing the refractive index difference between the dispersion and sample. The refractive index is the ratio of the speed of light in a vacuum to the speed of light in matter and is always greater than 1. For any substance, the refractive index is constant and only depends on wavelength and temperature. The greater the refractive index, the slower the propagation speed. Substances that use more than one index of refraction are said to be birefringent. Birefringence refers to the numerical difference between the maximum and minimum refractive index of an anisotropic substance. For example, the two refractive indexes of calcium carbonate crystal are 1.658/1.486, and its birefringence is 0.172. There is no birefringence for isotropic substances. The refractive index of a substance is determined by its atoms and molecules. If a substance is used for large birefringence, it is possible to make predictions about how its molecules will pack even if its crystal structure is not known. It is more meaningful when the predicted results are consistent with the crystal properties observed under the microscope (such as needle shape.). For example, planar molecules tend to align parallel to each other, giving the crystal a needle-like shape, while elongated molecules tend to align sequentially, giving the crystal a layered shape.
7.1. Determination of refractive index
The refractive index of a sample can be measured by the immersion method. Immerse the sample to be tested in a liquid with a known refractive index. When the refractive index of the sample to be tested is greatly different from that of the immersed liquid, the sample is clearly visible. As the refractive index decreases, when the refractive index of the sample and the immersed liquid are At the same time, the sample becomes invisible, and the refractive index of the infiltration liquid is the refractive index of the sample. Most commercial infiltration solutions are organic reagents and carry the risk of dissolving the sample. If the dissolution process is slow, the measured refractive index is relatively close to the actual value. If the dissolution is fast, the infiltration solution needs to be saturated, and then a refractometer is used to measure the refractive index of the saturated solution, and then the refractive index of the sample is detected.
Many methods can be used to determine when the refractive index of the sample and infiltration fluid are the same. The most commonly used of these methods is the Becke test. This method is simple and easy to implement and can distinguish a refractive index difference of 0.001. The Becke test is performed by comparing the refractive index of the sample and the infiltration fluid. If unpolarized light is used, the average refractive index is measured for anisotropic materials.
7.2. Becke test
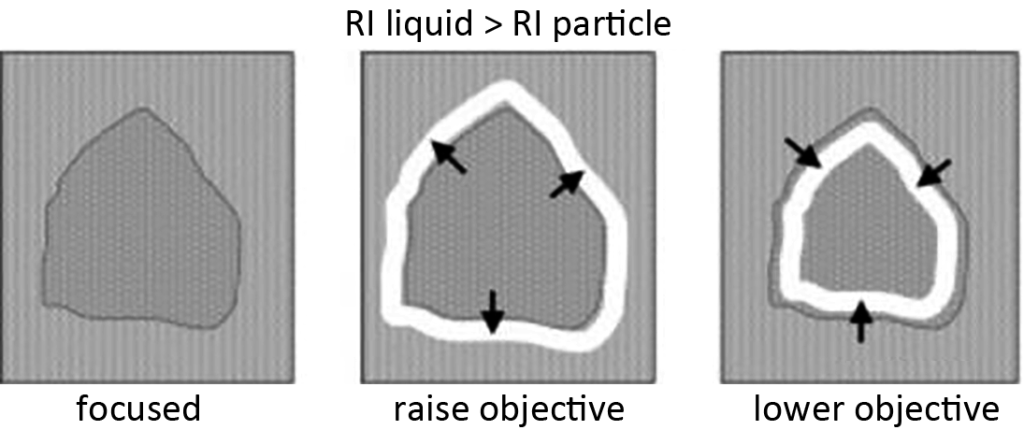
The Becke test is performed through the bright halo at the edge of the sample and infiltration solution (called the Becke line). As the sample is focused up and down, the Becke line moves back and forth across the interface between the sample and the edge of the infiltration solution. A simple rule for performing Becke tes is “bottom to top” or “low to high”. As the distance between the eyepiece and the sample becomes smaller (moving the stage upward), the Becke line will move from the side with a larger refractive index to the side with a smaller refractive index, and vice versa. As shown in Figure 7, in this figure, the refractive index of the dispersion is greater than the refractive index of the sample. The Becke line disappears when the refractive index of the sample and the infiltration solution are the same.
§8 particle size
Optical microscopy can effectively measure the particle size of particles (powders) in the range of 1-400 μm. However, if you want to accurately detect the particle size of powders less than 5 μm, it is recommended to use a scanning electron microscope. When equipped with a measuring scale in the eyepiece, the observed particles can be measured, but the scale must be calibrated. For spherical particles (rarely encountered in pharmaceuticals), diameter alone is sufficient to describe their size. For non-spherical particles, many statistical particle sizes are also used to describe their size, such as Feret diameter and Martin diameter. and projection diameter, etc. When comparing particle sizes between different samples, it is not necessary to perform precise particle size distribution measurements every time. Optical microscopy can also be used for rapid analysis. The average particle size can be obtained by observing particles of different sizes in the prepared sample. Although this method is not accurate enough, it is convenient and fast, and it is sufficient for distinguishing samples with large differences in particle size.
§9 particle shapes
The appearance or crystallinity of a crystalline substance is determined especially by its internal molecular structure. At present, there are many crystallographic phenomena specifically used to describe the various crystal habits that exist in the seven crystal systems. In conventional microscopic observation, it is unrealistic or unnecessary to identify the crystal patterns (such as orthorhombic crystal system, complex hexagonal bipyramidal crystal group, wedge-shaped crystal group, etc.), especially when the appearance of the crystal form is different only due to When caused by the uneven formation of crystal planes during the growth process. But when crystallography is described in a more concise and understandable way, it is very suitable for detecting batch-to-batch differences in crystalline compounds. In addition, crystal addiction has a great impact on the tabletability and dissolution of drugs.
Six crystal shapes are recognized, and they can occur in any of seven crystal systems. USP also uses these to describe the crystal shape, which will be described separately below. The schematic diagram is shown in Figure 8.
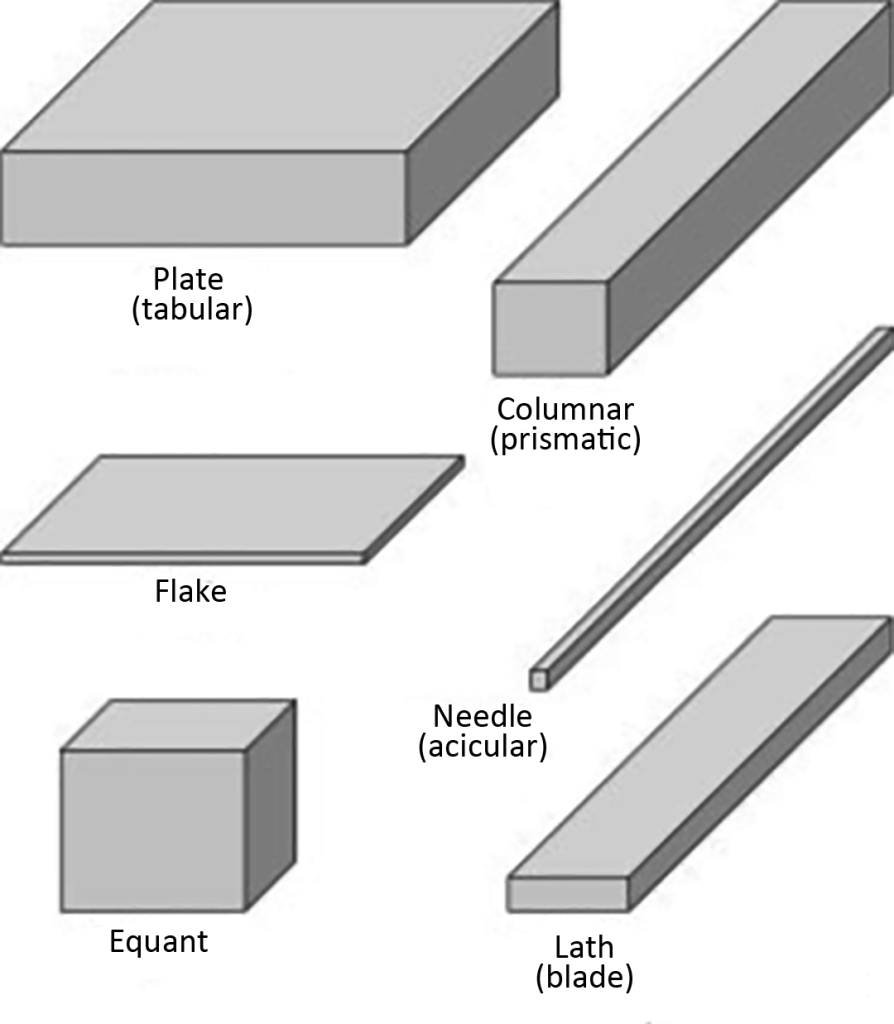
- Equant crystals: such as cubic or spherical crystals
- Plates crystal: flat, length and width close to thickness and slightly thinner
- Flake crystal: flat, with length and width close to the thickness and thinner than the plate
- Laths: elongated, thin blade-like crystals
- Needles crystals: highly elongated, elongated, approximately square or circular in cross-section
- Column (Columns) crystal: stretched prism shape, width and thickness are larger than needle shape
Words such as hexagon, cube, and rhombus must be used with caution when describing crystal shapes, because these highly specific descriptions, when used, imply sufficient knowledge of the crystal system to which they belong. Instead, descriptions such as hexagonal, cubic, rhombus, and rock are more appropriate and informative. Sometimes the crystals will also show special characteristics, and sometimes they are geometric, such as square or rhombus. Therefore, the crystals can also be described as: square, rectangular or rhombus-shaped plate crystals, triangular-like flake crystals or point-shaped flakes. There are many different shapes of crystals. In powdered crystalline materials, a range of different shapes may occur depending on the growth rate of different crystal planes. In a large number of plate-shaped crystals that appear to be hexagonal, some may appear to be triangular or rhombus-like. Powders that have been crushed or ground no longer provide any information about the original crystal appearance.
In addition to the above description of crystal properties, using the following terms to describe crystal appearance can provide more comprehensive and rich information.
- Angular: Qualitative shape of edges or corners (as in broken crystal fragments)
- Rounded: No discernible character around edges or corners
- Irregular: Shapeless, lacking discernible geometry
- Granular: irregular in shape but equiradial overall
- Euhedral: The crystal presents its own complete crystal planes
- Anhedral: a crystal, but without its own crystal faces
- Polymorph (Polycrystalline): multiple types are closely mixed
- Cryptocrystalline: a polymorphic substance that cannot be determined by optical microscopy, but has XRD diffraction images
- Transparent (Transparent:): Generally clean, but may have cracks or inclusions
- Translucent: Most of it is hazy due to containing small cracks or polymorphs.
- Opaque: not transparent due to light scattering or extremely high refractive index of the crystal
- Colored: distinctive color
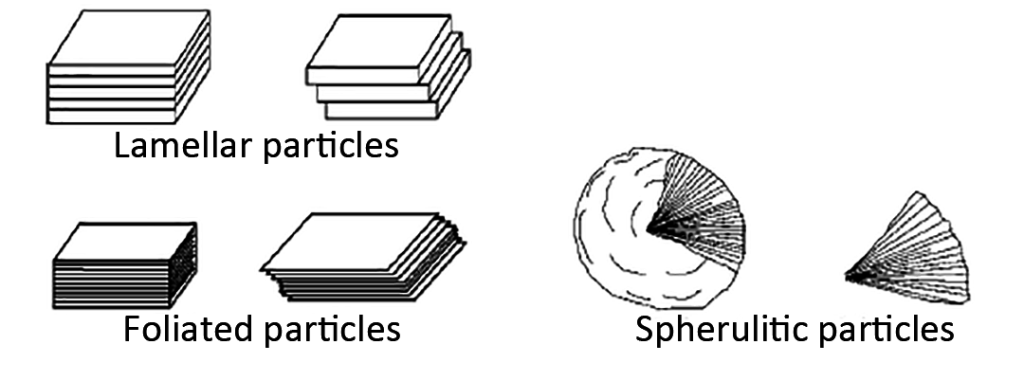
- Lamellar: formed by stacking plates (see Figure 9)
- Foliated: stacked leaf-shaped flake crystals (see Figure 9)
- Spherulite: spherical crystal with needle-like interior
§10 Comparative Powder Samples
When observing samples, it is best to take pictures to compare the differences between samples from different batches. These differences may include particle appearance and particle size. This comparison will be more convenient if they are all observed at the same multiple. It is also best to have a relevant and brief description. The observation report on the sample should include but not be limited to the following:
- Characteristics of crystals
- Particle size range and average particle size of crystals
- Describe the relationship between crystals (distribution)
- Any information on crystallinity (is there birefringence, etc.)
- Microscopic image (including scale bar and magnification)
- Dispersion medium
- Microscope model
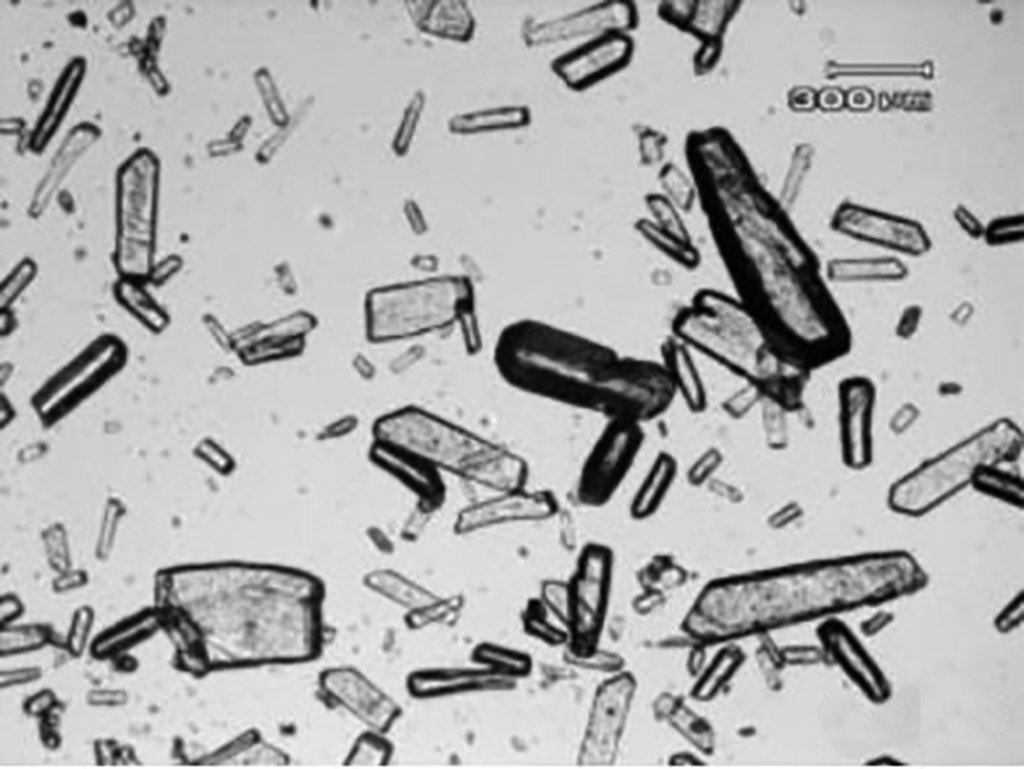
An example of using a microscope to observe aspartic acid is as follows, and the picture is shown in Figure 10. The sample is a mixture of needle-shaped, lath-shaped, plate-shaped and prismatic colorless powders. The length of needle-shaped, lath-shaped and prismatic particles ranges from 50-600 μm (mostly around 150 μm), and the aspect ratio of these particles ranges from 2:1 to 15:1. When observed using polarized light, the particles have bright interference light that disappears every 90 degrees of rotation, indicating that they are crystalline materials. The sample powder was dispersed in silicone oil and observed using a Nikon Optiphot POL microscope.
§11 Hot stage microscope
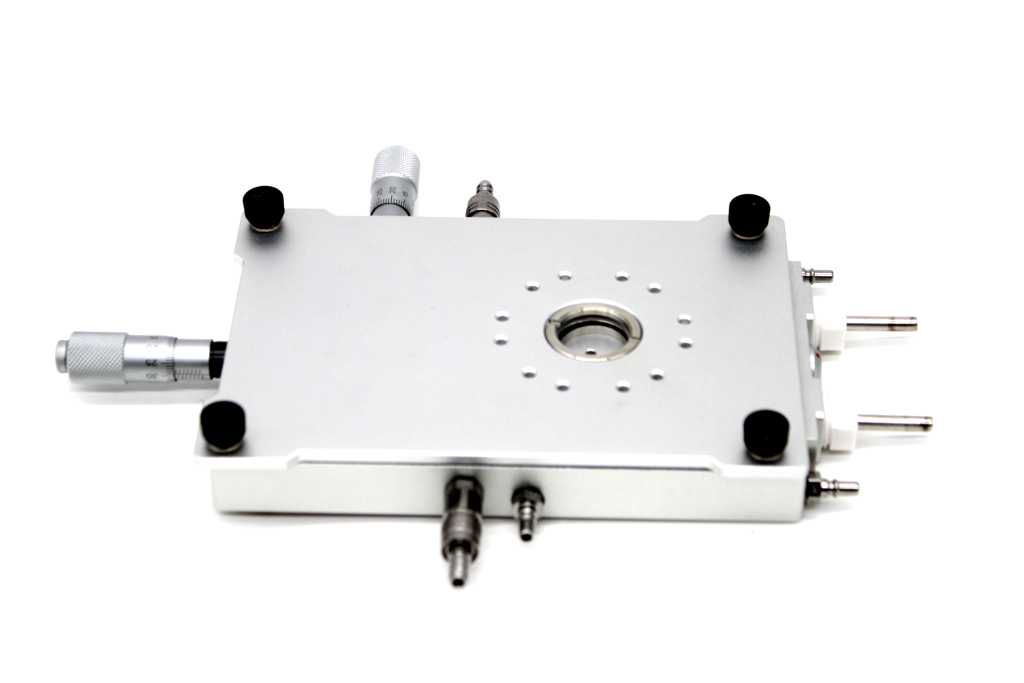
Hot-stage microscopy can be used to observe the sample while it is being heated (cooled) by placing a hot stage on the stage. The schematic diagram is as follows. As an analytical method, hot-stage microscopy can be used to observe a series of phenomena caused by thermodynamics, such as melting, crystallization, sublimation, desolvation, phase change, and thermotropic crystallization. In addition, because it can quickly analyze the thermodynamic phase diagram, it can also complement each other with thermal analysis methods such as DSC, DTA, and TGA to a certain extent.
§12 Microscopes as Miniature Laboratories
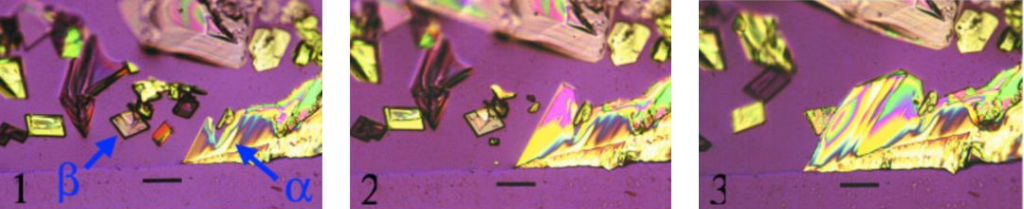
In addition to observing and characterizing crystalline compounds, polarizing microscopes can also be used to observe crystal growth. In addition, solution-mediated crystalline transformations can be observed. An excellent example of phase change in solution mechanisms and guidance in solid mechanisms is potassium nitrate. When a drop of slightly unsaturated potassium nitrate solution is added to the glass slide (no cover slip is loaded, the liquid can slowly evaporate at room temperature), as the liquid evaporates, rhombohedral metastable beta crystals will first be seen at the edge of the droplet. appears (Figure 12-1). After a short time, the appearance of highly birefringent plate-like α crystals that are stable at room temperature is observed. As the α crystal grows, a phase change in the solution mechanism will occur, causing the β crystal adjacent to the growth direction of the α crystal to dissolve (Figure 12-2). When the α crystal contacts the remaining β crystal during the growth process, it will occur again at the same time. Through the phase change of the solid phase mechanism, eventually all the crystals in the droplet will transform into α crystals.
§13 Pleochroism
Many organic and inorganic compounds are colored, and different crystal forms can sometimes be distinguished by color. For example, mercury iodide has a tetragonal crystal system at room temperature. The stable phase is red and the metastable phase is orange. When the temperature is higher than 127°C, its stable phase changes to yellow orthorhombic crystal. Tie. The transition between red and yellow phases is reversible and can be observed with the naked eye using a polarizing microscope. This phenomenon of different crystalline forms having different colors is called “color polymorphism”. The reason for this phenomenon is the difference in conformation between different crystal forms. When a transparent colored crystal is observed using white plane-polarized light, the color of the crystal or the intensity of the color will often change as the stage is rotated. The reason for this change is the selective absorption of light in specific vibration directions by the crystalline material.
Colorless or isotropic crystal compounds generally do not exhibit pleochroism. In addition, some colored crystal compounds do not exhibit pleochroism if their absorption in all directions is relatively close. However, when a highly birefringent colorless crystal is dispersed in a liquid and the refractive index of the liquid is close to one of the principal refractive indexes of the crystal, pleochroism may occur when observed with rotation under plane-polarized light. Sometimes the color of the crystal may also be caused by colored impurities inside and on the surface of the crystal. Organic compounds with pleochroism generally contain chromophores (azo groups, conjugated vinyl groups, etc.). When the direction of light vibration is consistent with the direction of the chromophore, the absorption of light is strongest. Therefore, in the absence of missing XRD data, if pleochroism is observed in a compound, it can also provide useful information on the arrangement and packing of the compound molecules.
§14 Crystal mechanical properties
In the early stages of the development of medicinal compounds, due to the small number of samples, nanoindentation instruments can often only be used to detect mechanical properties such as hardness, elastic viscosity, plasticity and brittleness. However, optical microscopy can also be used to conduct qualitative analysis of substances, such as whether the substance undergoes plastic deformation or brittle fracture, and whether the physical properties are soft or hard, etc. Just put a small amount of sample (microgram level) on the slide, load the coverslip, press it gently or make relative movements, and then place it under the microscope for observation. For hard, brittle and broken samples, they will appear in the form of dust. The samples with soft plastic deformation will be stretched or sticky and even leave traces on the upper and lower glass slides.

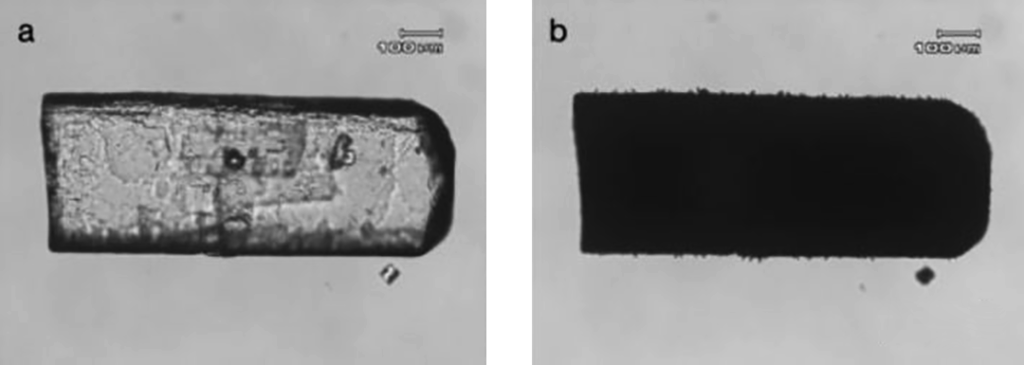
§15 Pseudomorph
When a crystalline compound undergoes a physical or chemical change (such as its solvation or phase change), its crystal appearance may change, resulting from changes in the internal structure of the crystal, sometimes even leading to the deconstruction of the crystal due to significant changes in volume. But sometimes this change can also be non-destructive: the internal structure of the crystal changes but its appearance does not change. This phenomenon is called pseudomorph (pseudomorph). Many hydrates or solvates will lose the corresponding crystal water and solvent when heated in air. Due to changes in density or arrangement, the crystals may become polymorphic and are often hazy or hazy when observed through transmitted light. Tight. Oxalic acid dihydrate is an example. When heated above 60°C, it changes from colorless (white) hydrate to opaque anhydrous due to water loss.